PHY2048C - Week 1 Activity
Match Graph
Plug the small end of the USB cable into the top edge USB socket on the Spark interface. Plug the other end into the computer on your desk. Plug a motion sensor into one of the sockets on the top edge of the Spark. Make sure the motion sensor is using the person range rather than the cart range, by using the switch on the top. Power up the Spark with the blue button on the bottom left edge.
Start the PASCO Capstone software on the Windows
desktop. Ignore (close) the licensing information window. Drag a Graph
from the right Display menu and drop it onto the Page. Click on the
<Select Measurement> vertical axis label, and select Position(m).
Capstone should now show a graph of position vs. time. You can adjust
the position and time ranges displayed by clicking and dragging the
axis numbers (range) or the axis itself (offset).
Place the motion sensor on the table with the sensor facing
away from the table, and with room to move 2 m away from the table without
hitting something. Click the Record button in Capstone to see how this works.
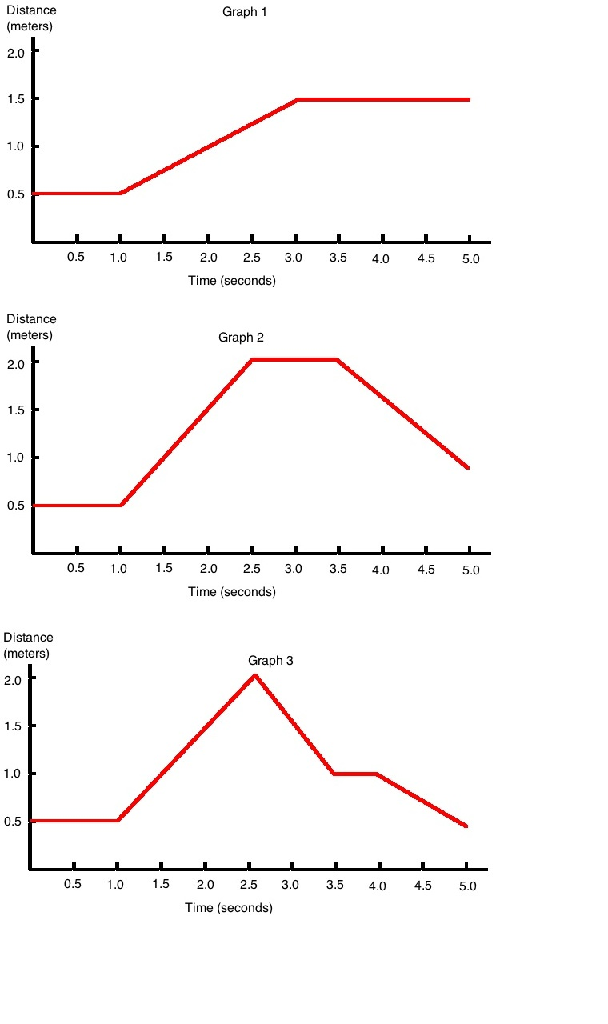
Have someone in your group stand in front of the sensor, at the initial distance shown in the first graph. Have someone else in your group start recording using the motion sensor. The third person can act as a coach/skeptic. See if you can match the graph by moving away from or toward the sensor. Rotate roles for each graph. Each member of your group should print out a different graph of the best match they attained (with the time axis adjusted to show 5 s, and the position axis adjusted to show 2 m), and hand it in with his or her name written on the top. Use the printer 'MCH0315 Printer'.