ggemass-dea4.ps.1.gif

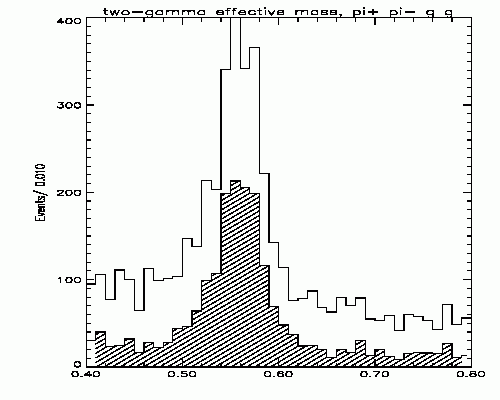
If the DEA cut functions correctly, it also should have an effect of the two-photon effective mass distributions.
If we select a data sample with 2 photons in the LGD and plot the two-photon effective mass, the distribution contain a background from events that initially had more than 2 photons, but the extra photons missed the LGD. The DEA cut is expected to remove events with "missing" photons, so it can be expected that the DEA cut will reduce the background on the two-photon effective mass distribution, and so decrease the background under the pi0 and the eta.
Figure 2 shows the two-photon effective mass distribution for a typical sample of 1995 14 GeV 0-2-2-LGD events with two photons detected in the LGD. The unshaded plot contains all events before the cut and the shaded plot shows the events left after the DEA cut.
ggemass-dea4.ps.1.gif
One can see that while the height of the pi0 and eta peaks decreases by a factor of two, the background decreases by about a factor of 3.
Figure 3 contains the same data as figure 2, but expanded around the eta peak.
ggemass-eta-dea4.ps.1.gif
The conclusion is that again, the DEA cut works as expected.