 |
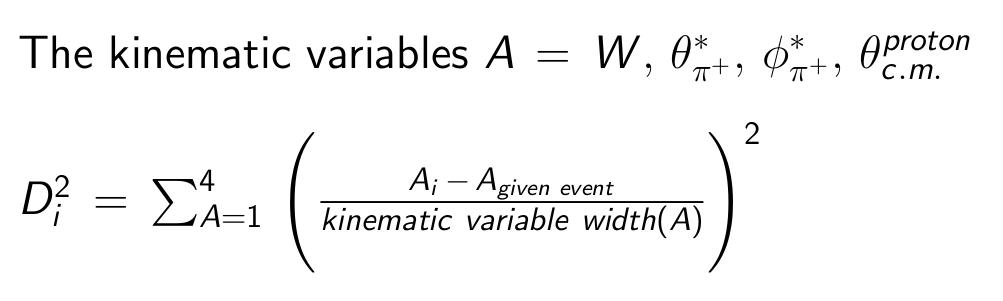
| The center-of-mass energy W | 1725 < kin_var[0] < 1775 | width = 50 |
| cos θ( π+ ,* ) | -1 < kin_var[1] < 1 | width = 2 |
| φ( π+ ,* ) | 0 < kin_var[2] < 2π | width = 2π |
| cos θ( proton, c.m. ) | -1 < kin_var[3] < 1 | width = 2 |
|
||||||||||||
|
| Old Algorithm | New Algorithm | ||||
| Num | Event Number | D2 | Num | Event Number | D2 |
| 1 | 91 | 0.146604 | 1 | 102 | 0.0211906 |
| 2 | 102 | 0.0211906 | 2 | 112 | 0.0361479 |
| 3 | 112 | 0.0361479 | 3 | 235 | 0.0375069 |
| 4 | 120 | 0.143016 | 4 | 341 | 0.021774 |
| 5 | 126 | 0.0670887 | 5 | 435 | 0.0223338 |
| 6 | 127 | 0.0660095 | 6 | 496 | 0.0338228 |
| 7 | 132 | 0.0718792 | 7 | 538 | 0.0349655 |
| 8 | 134 | 0.0903477 | 8 | 607 | 0.0417069 |
| 9 | 135 | 0.195679 | 9 | 611 | 0.0291455 |
| 10 | 143 | 0.103599 | 10 | 624 | 0.0393076 |
 |
 |
 |
|
 |
|
 |
|
 |
|
 |
|
 |
|
 |
|
 |
|
 |
|
 |
|
 |
|
 |
|
 |
|
 |
|
 |
 |
 |
 |
|
|
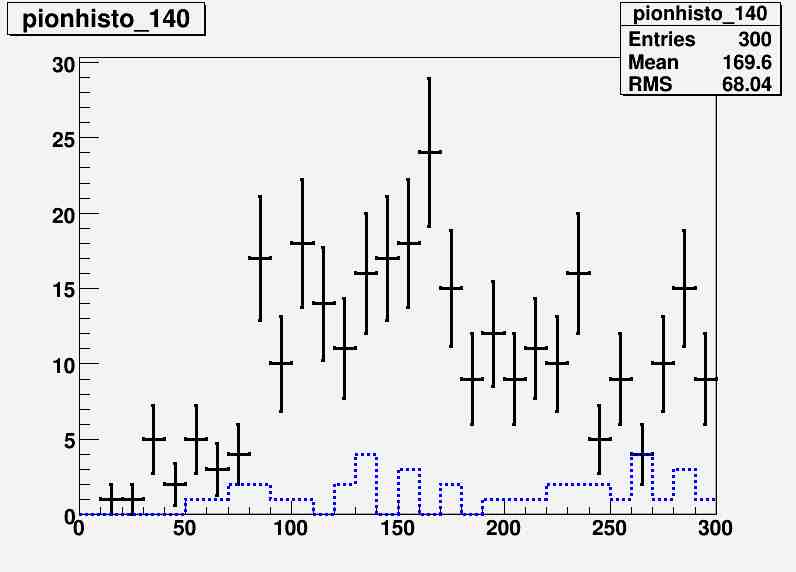
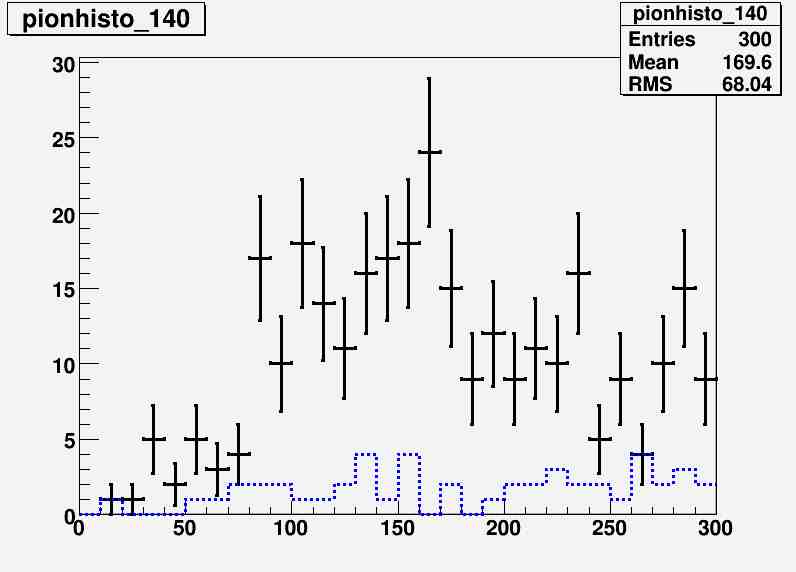
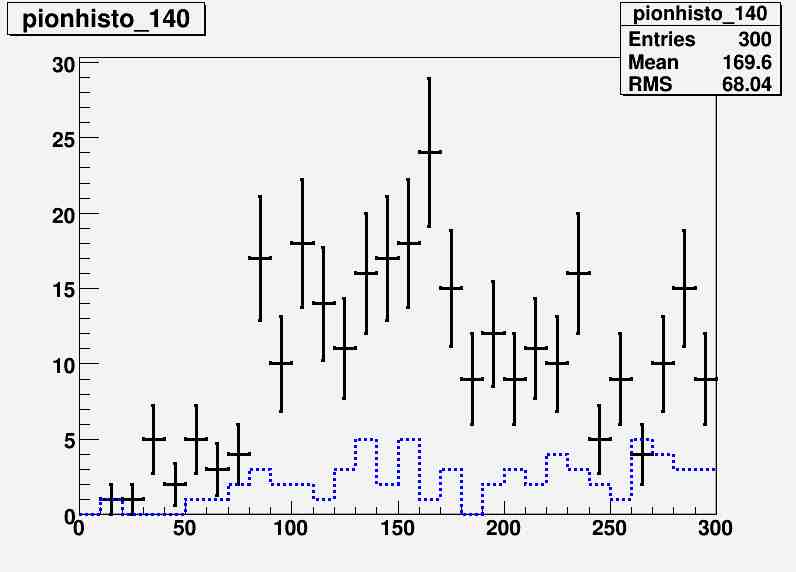
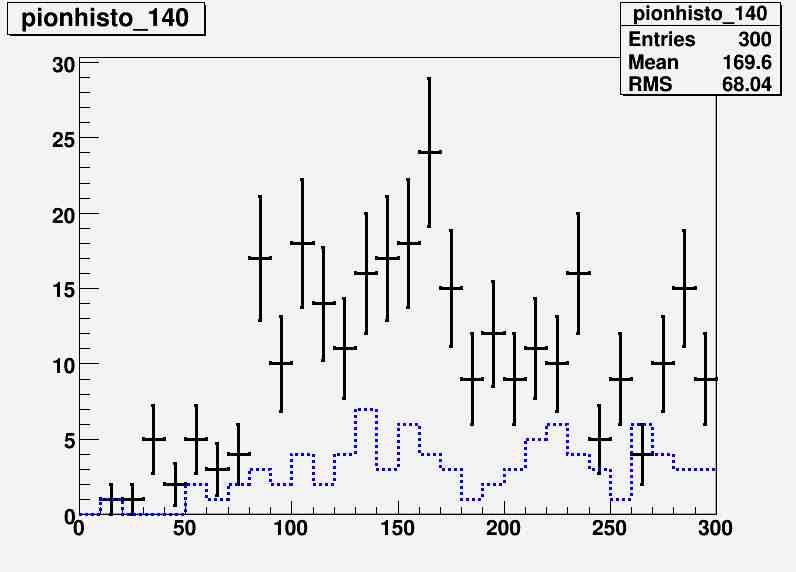
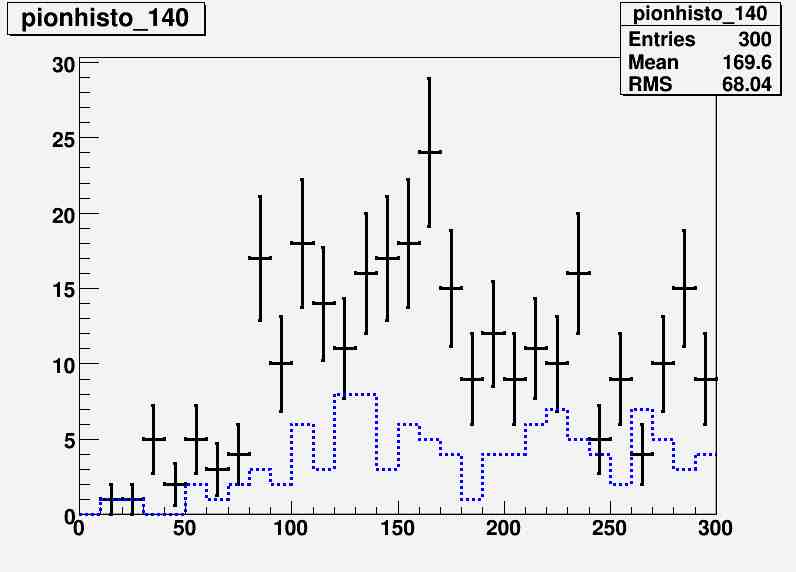
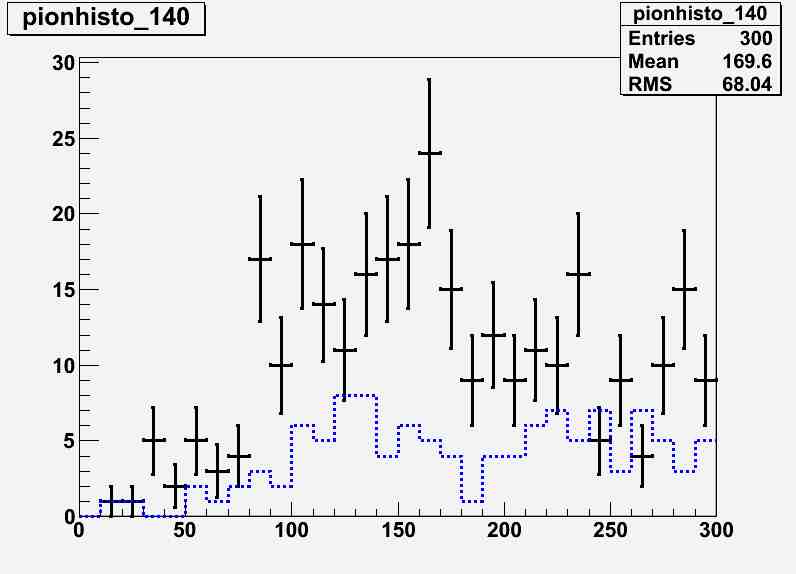
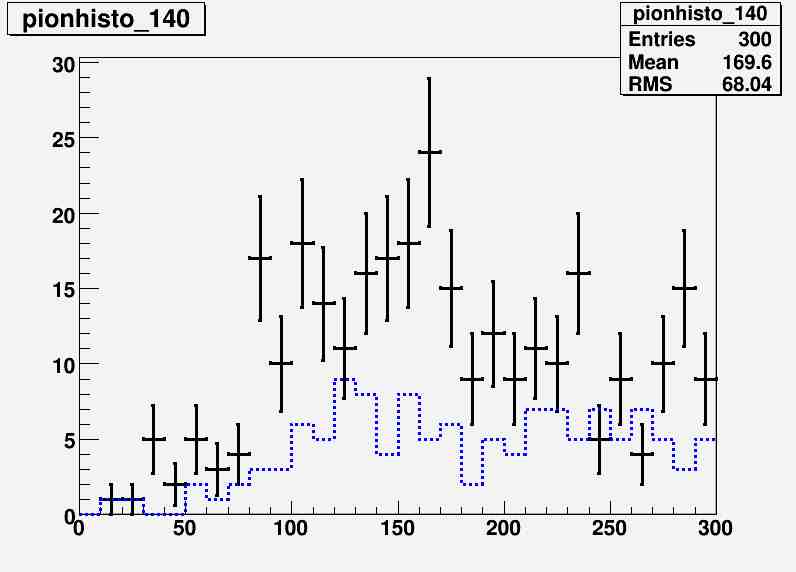
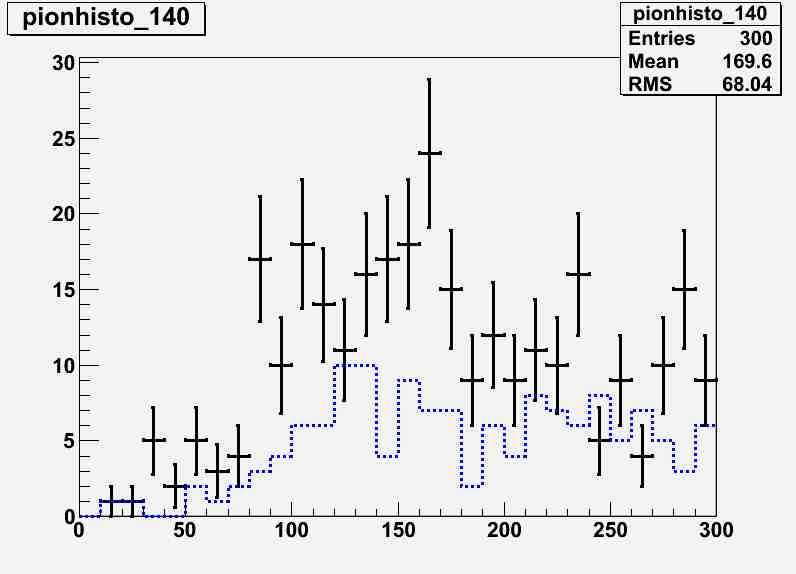
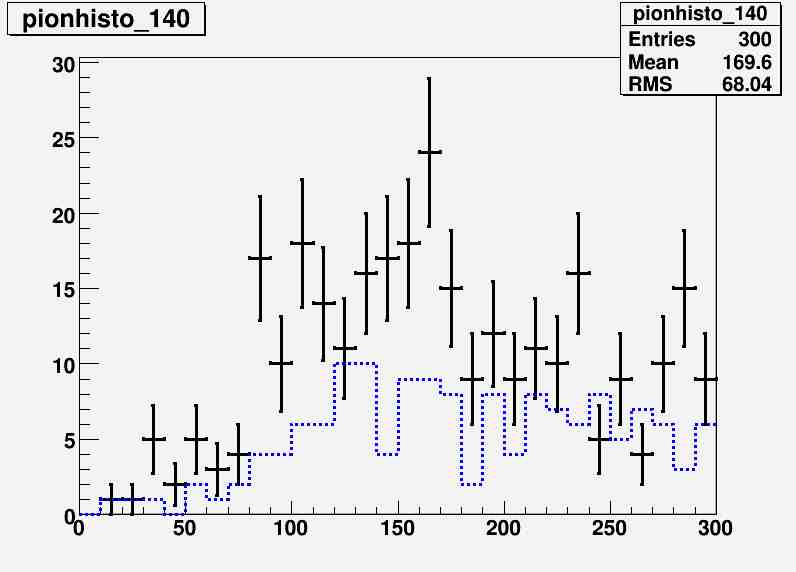
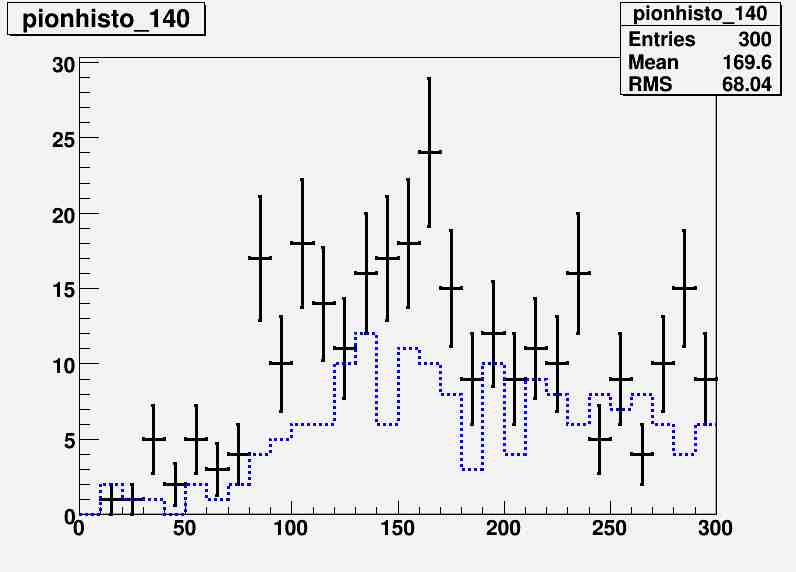
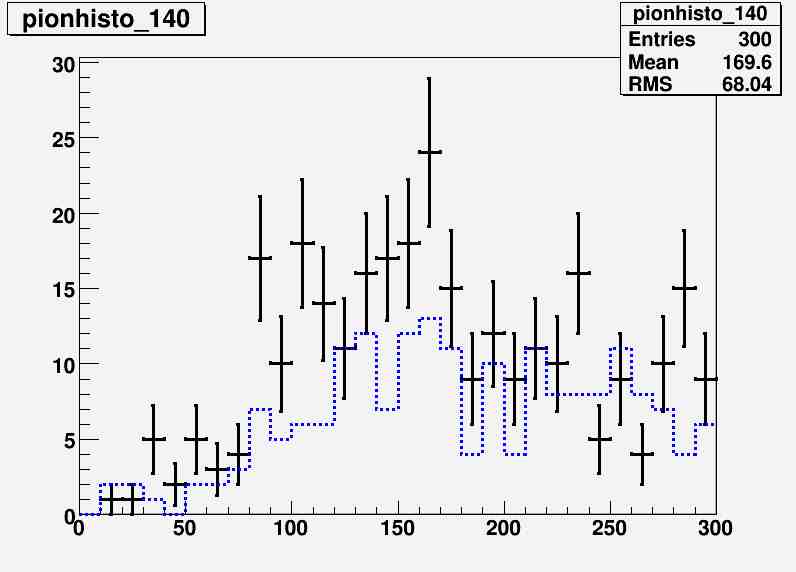
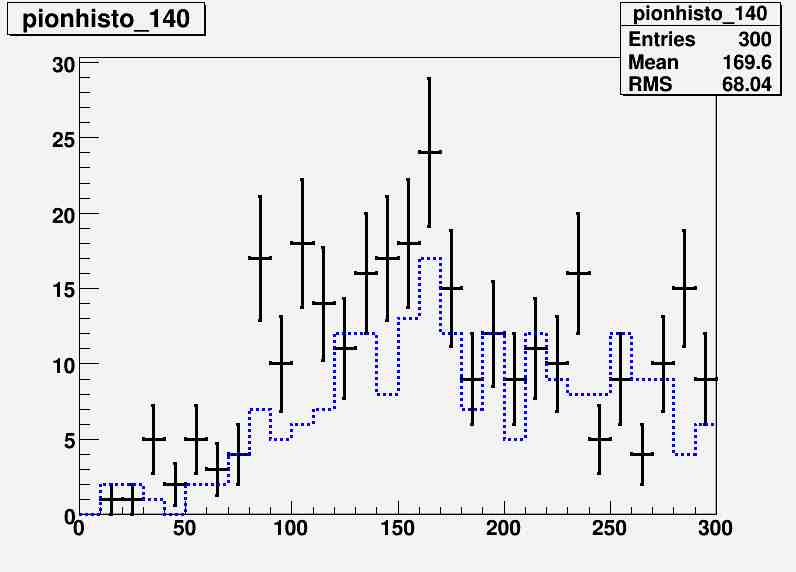
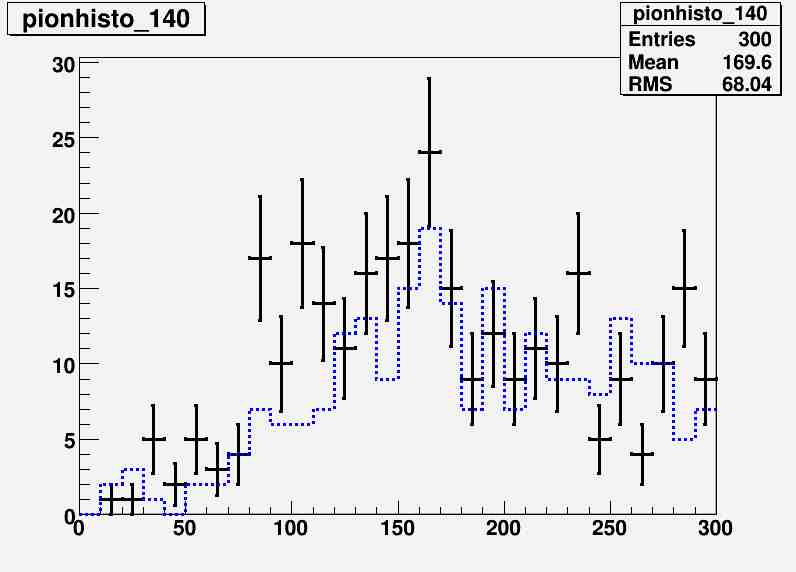
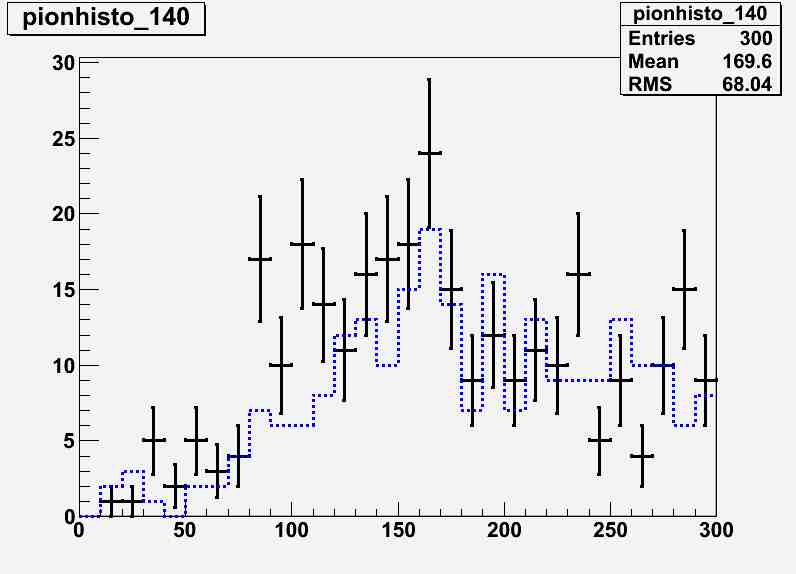
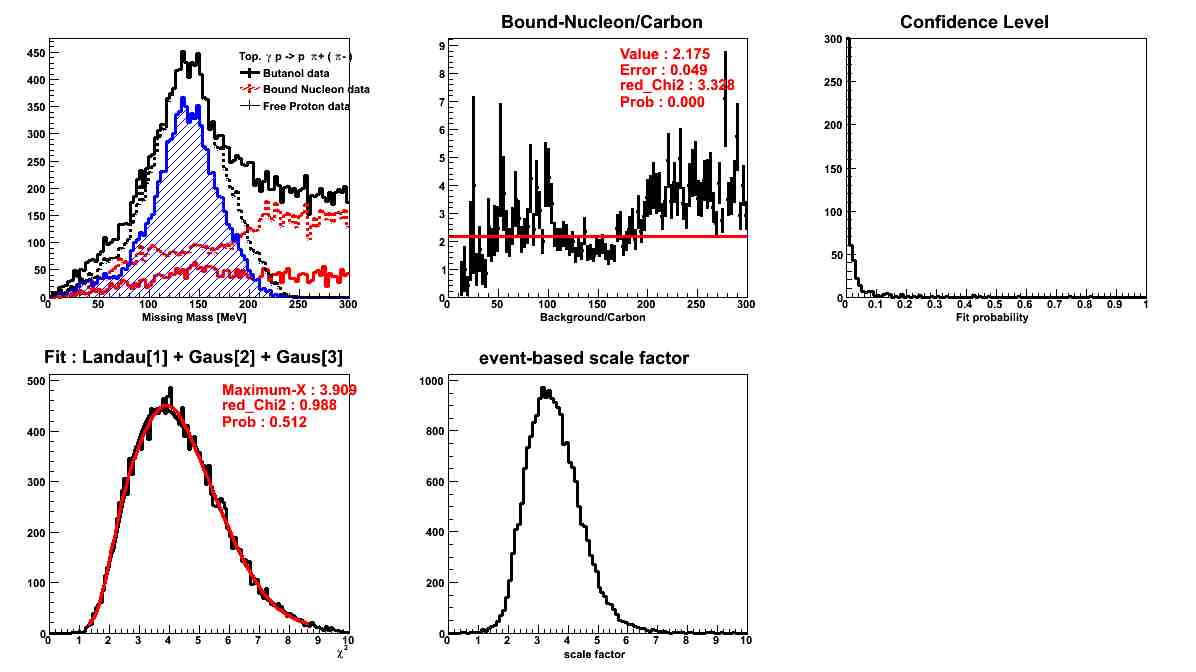
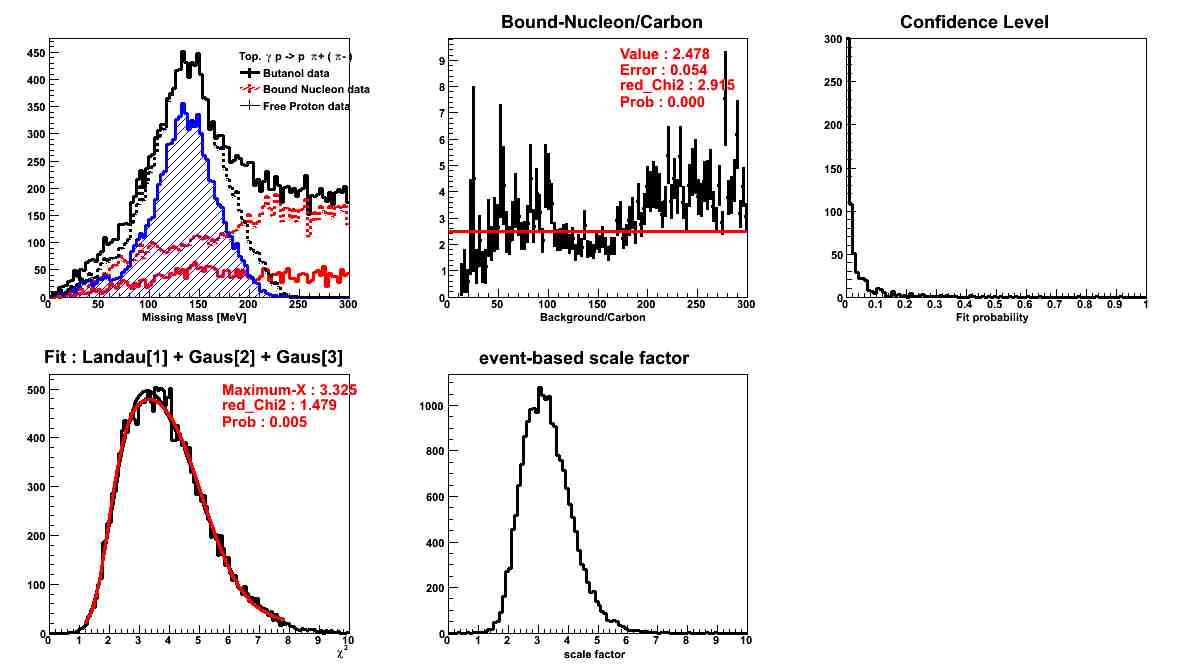
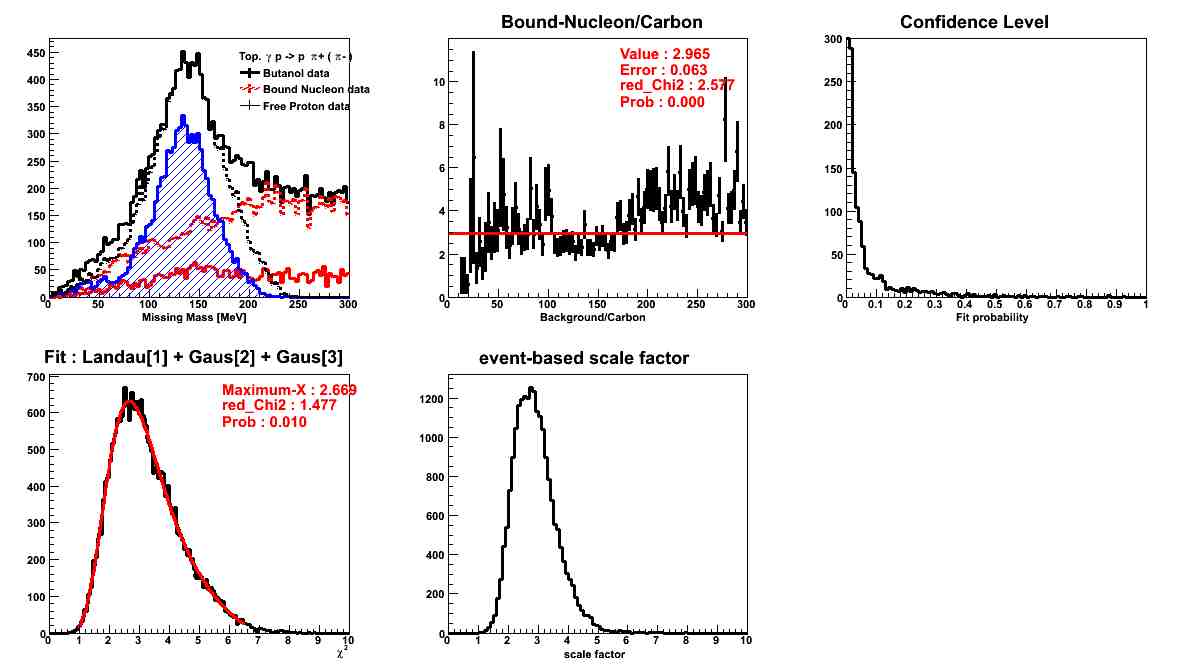
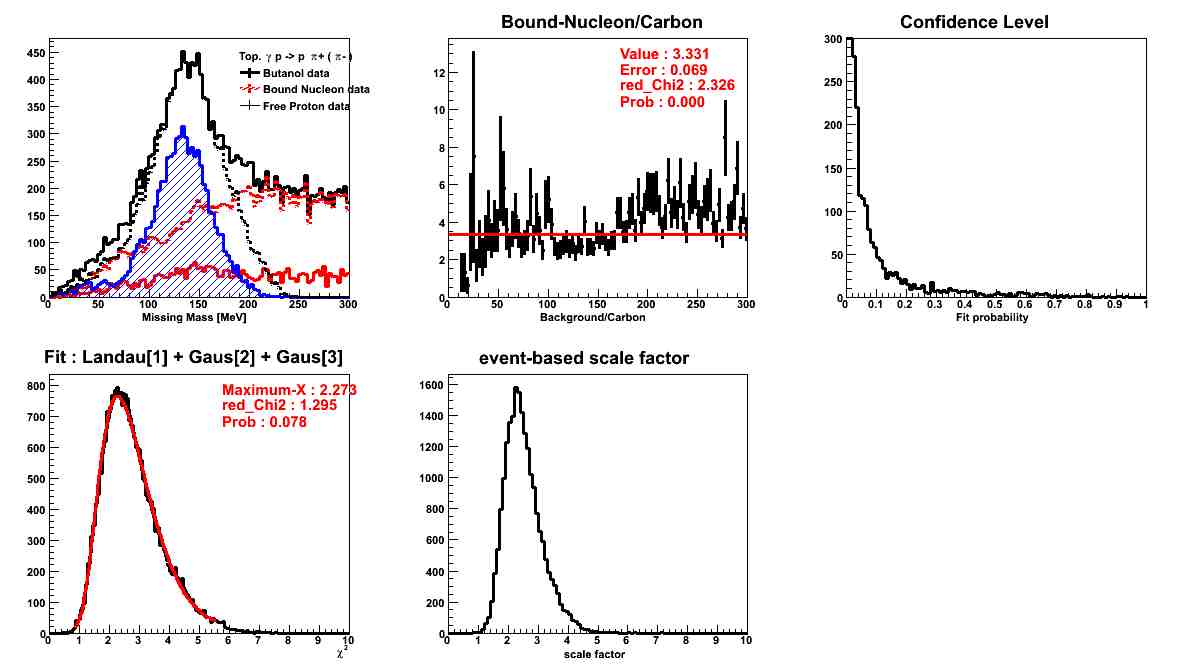
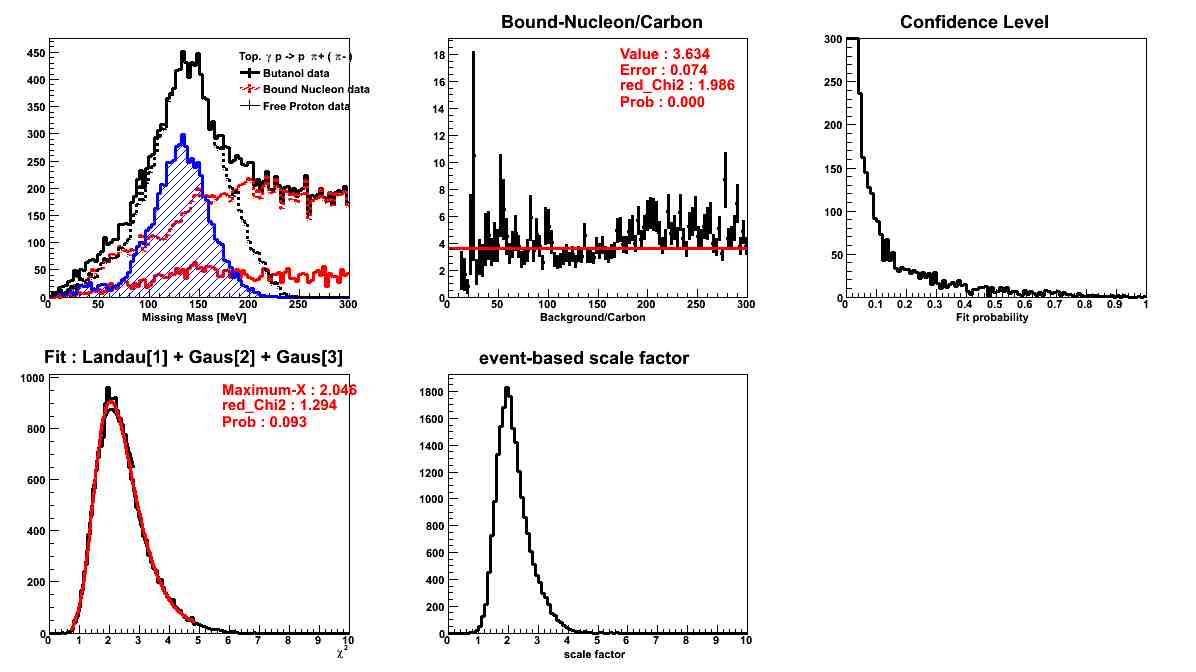
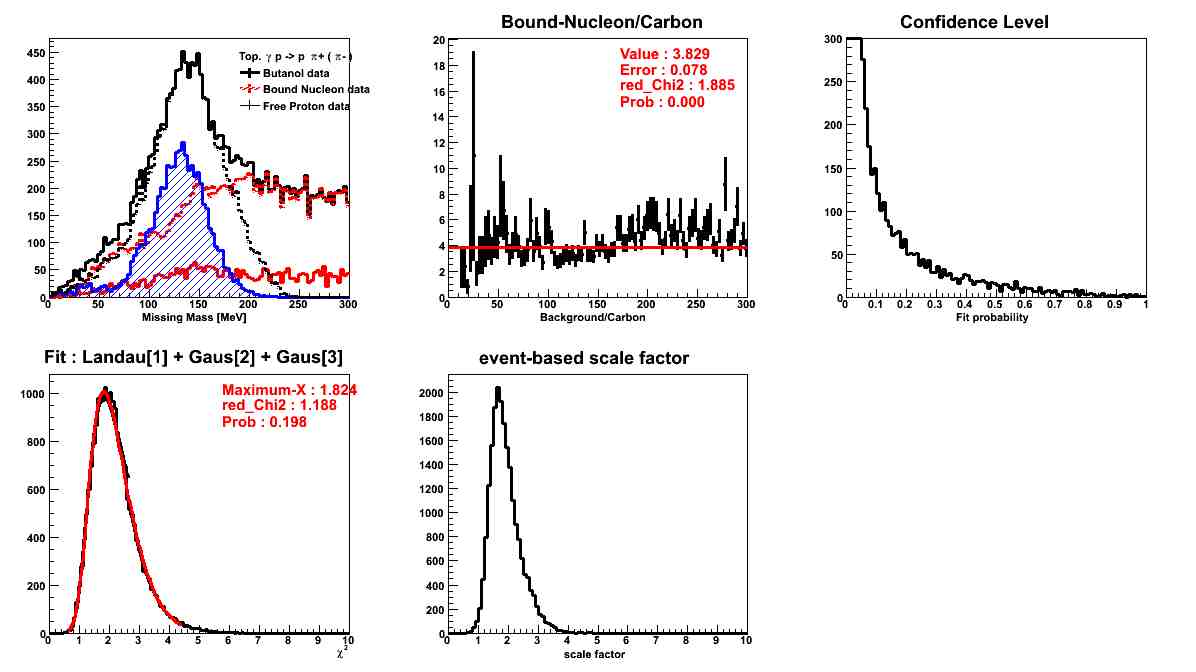
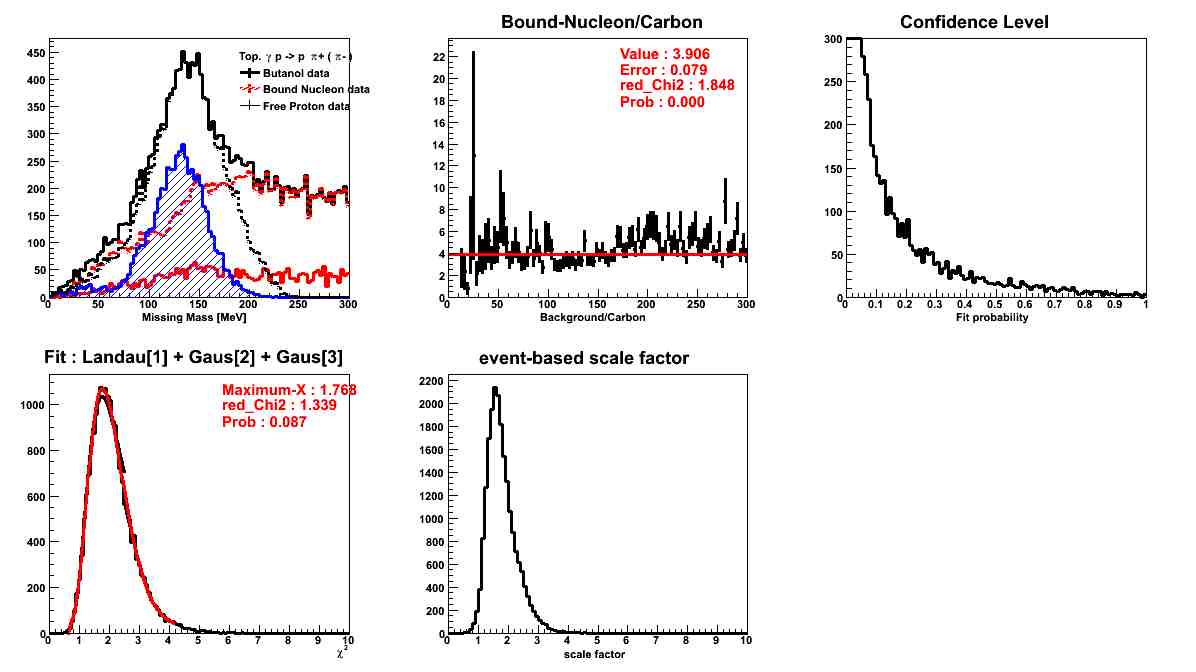
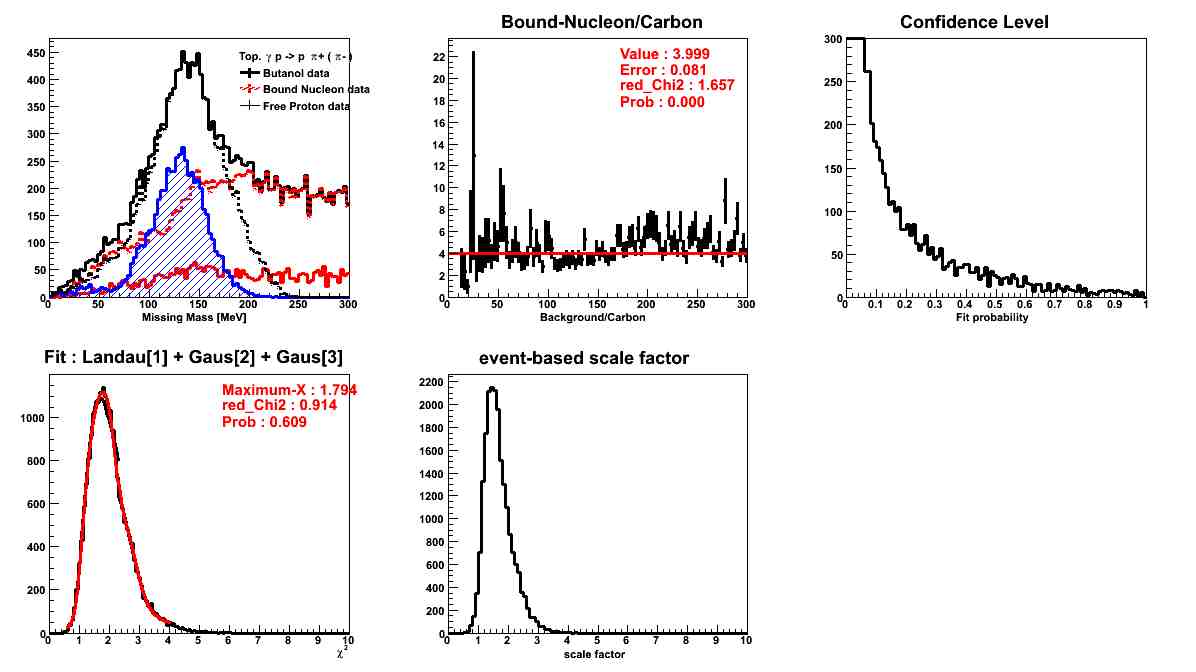
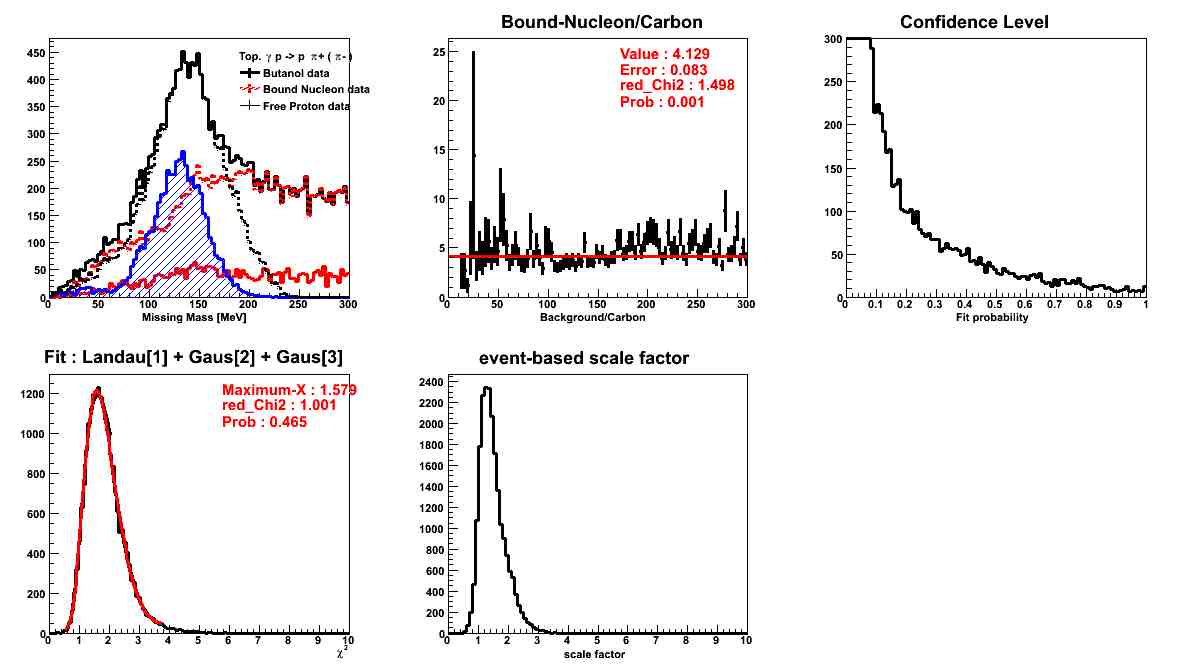
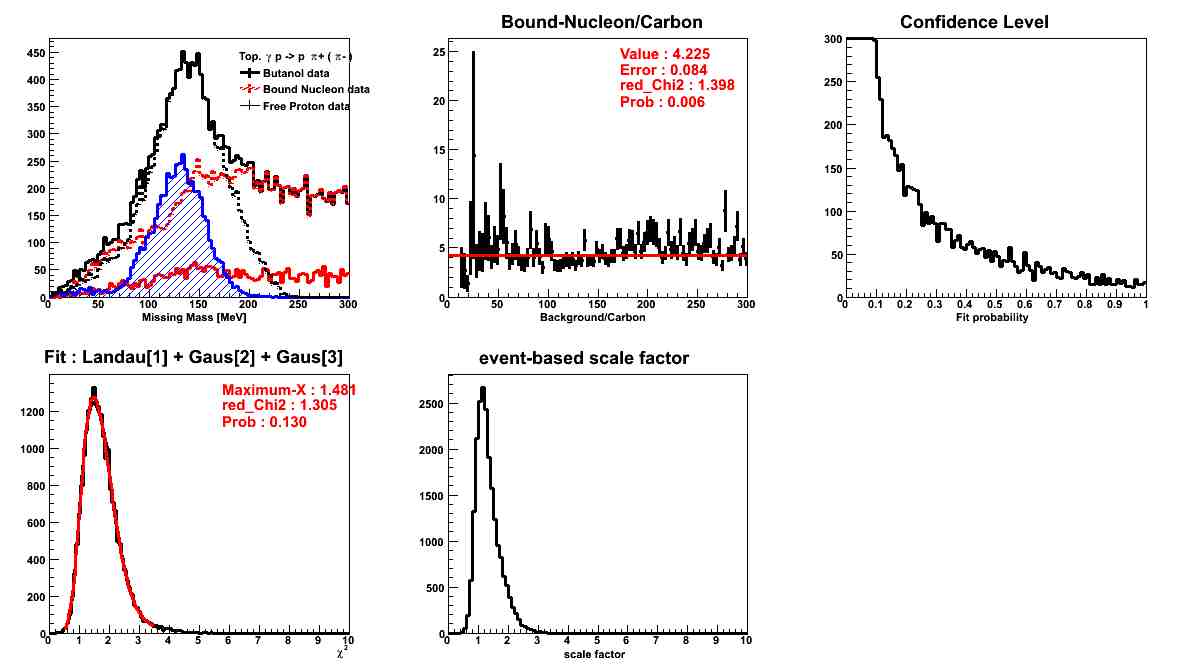
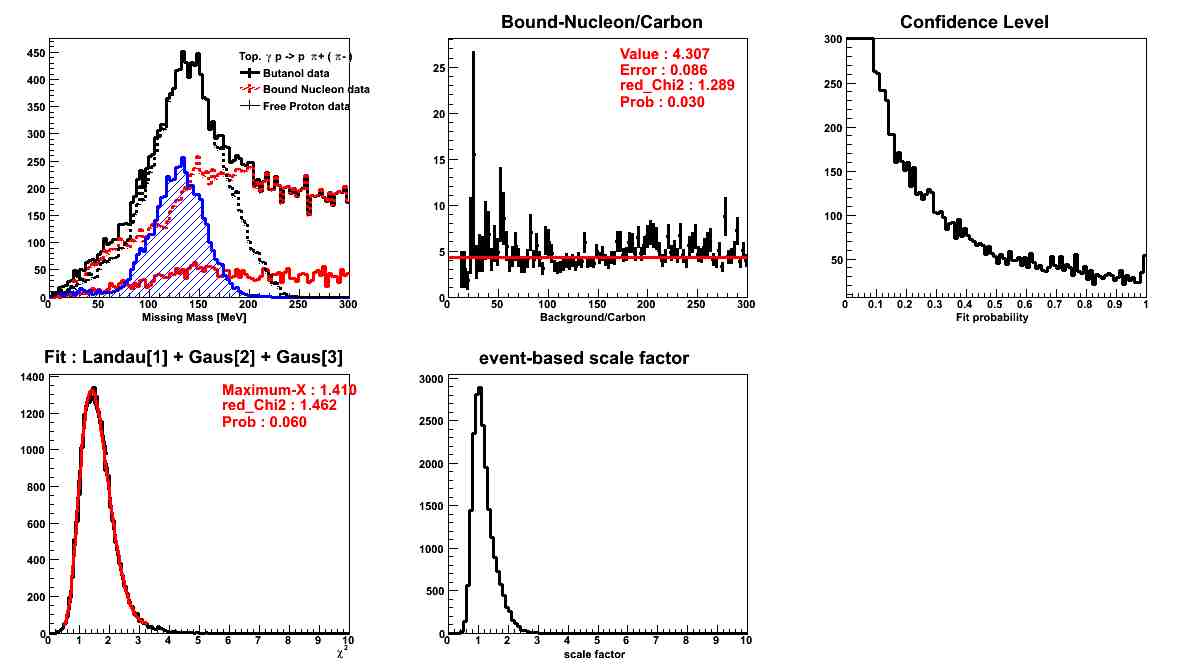
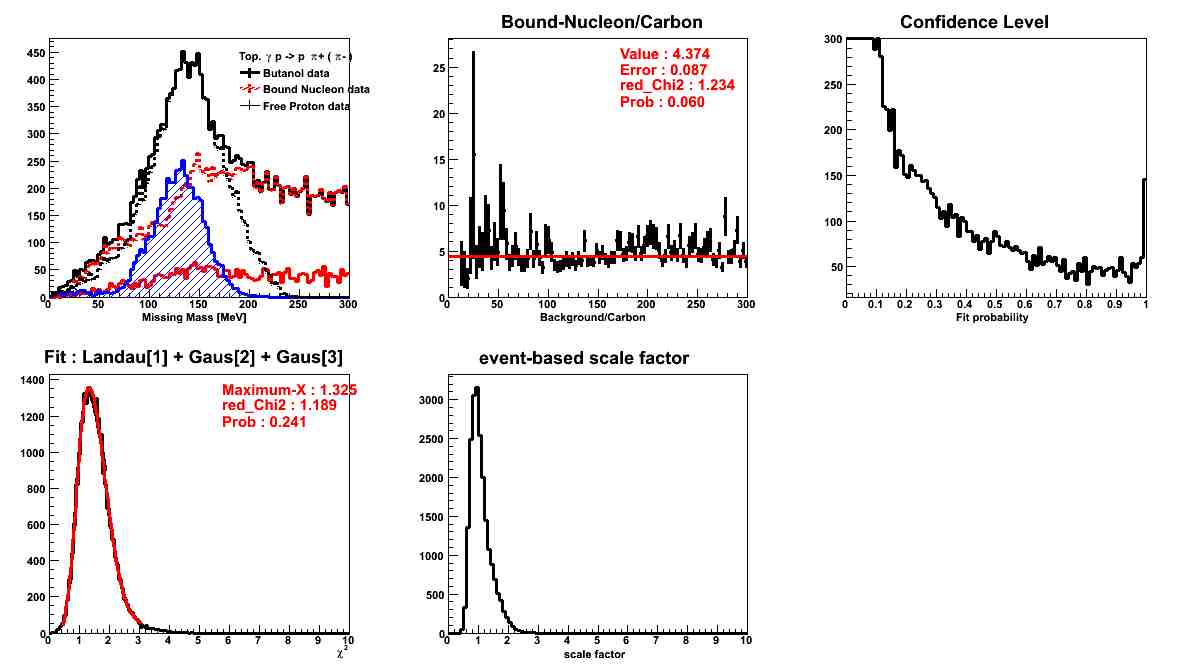
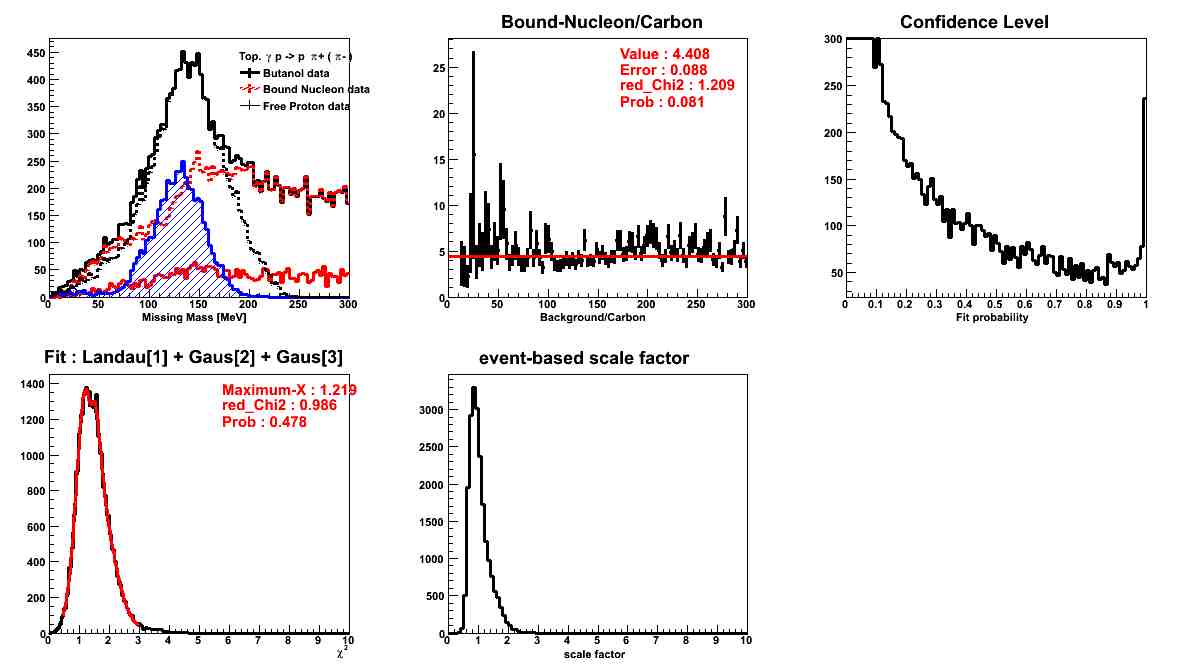
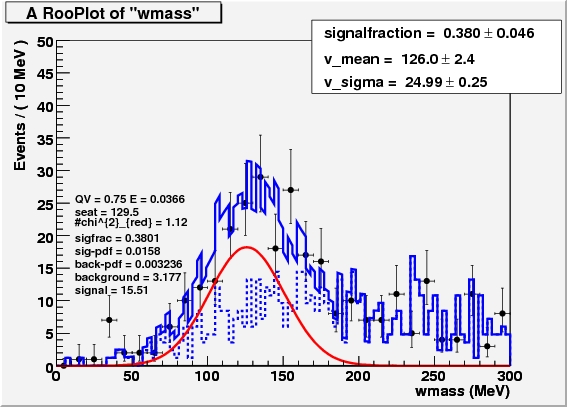
Input-histogram (Black : butanol, Blue : carbon ) |
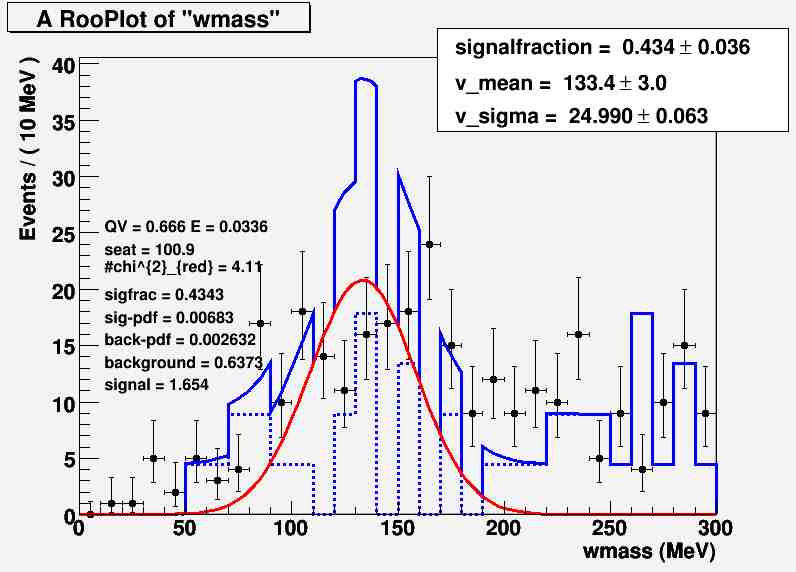
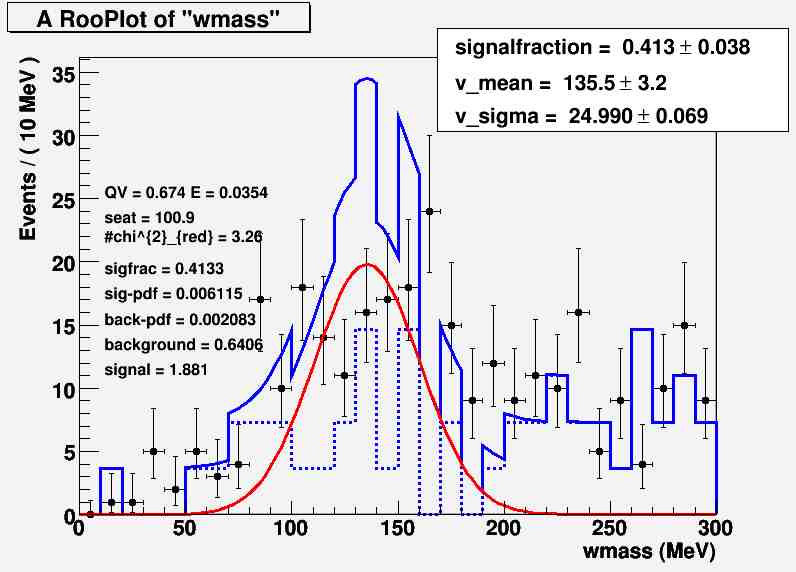
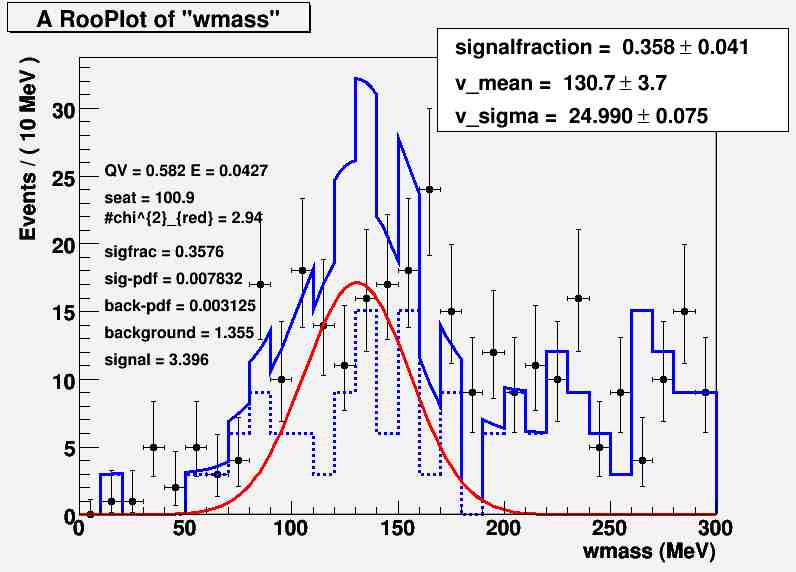
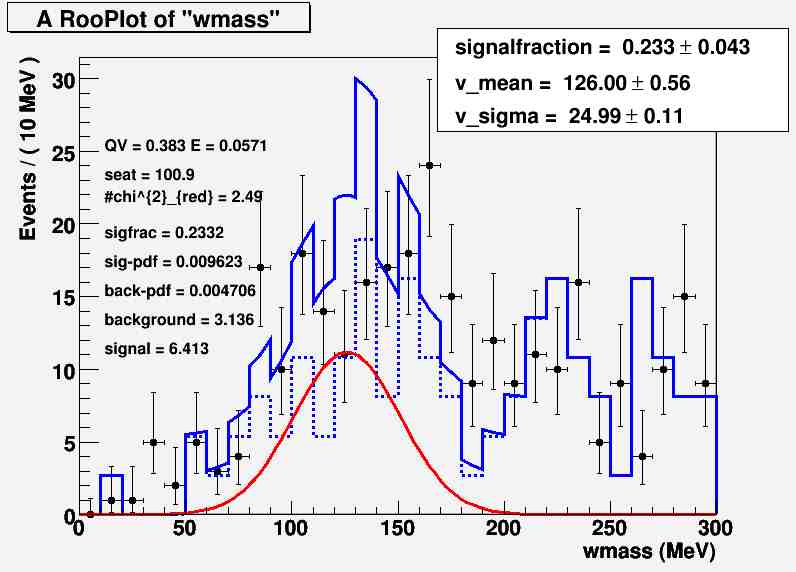
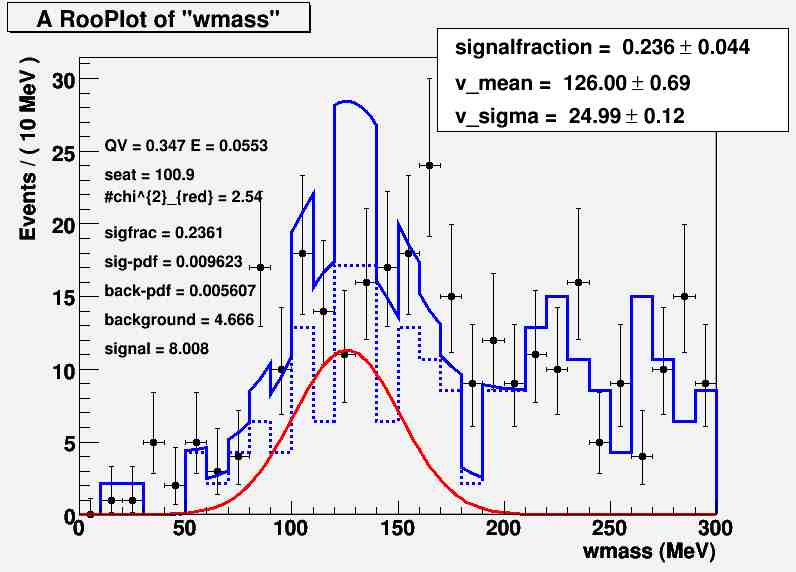
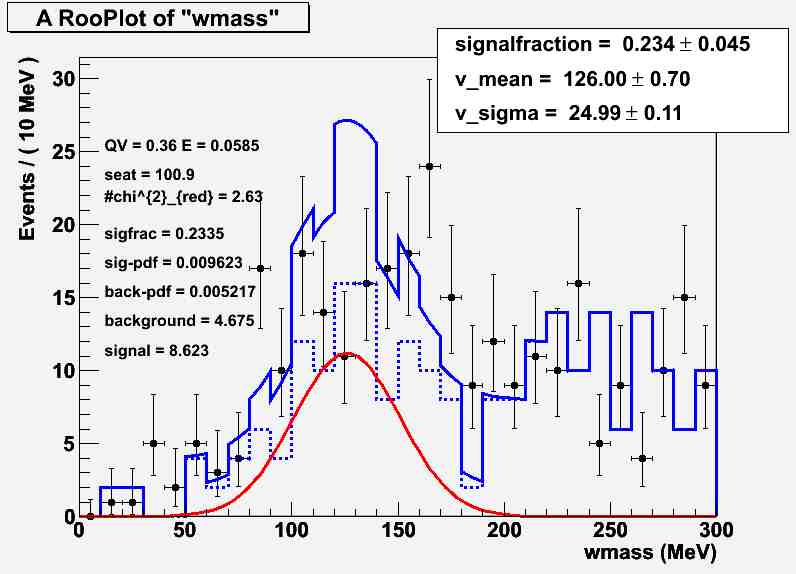
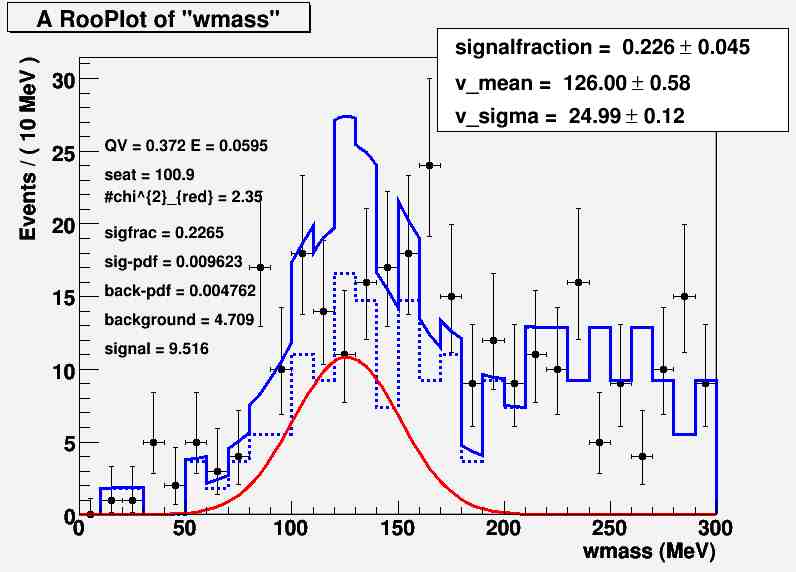
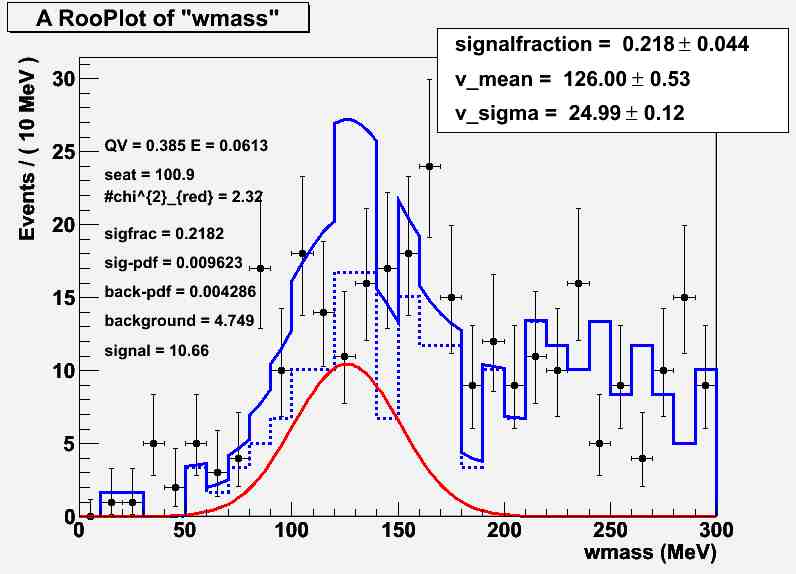
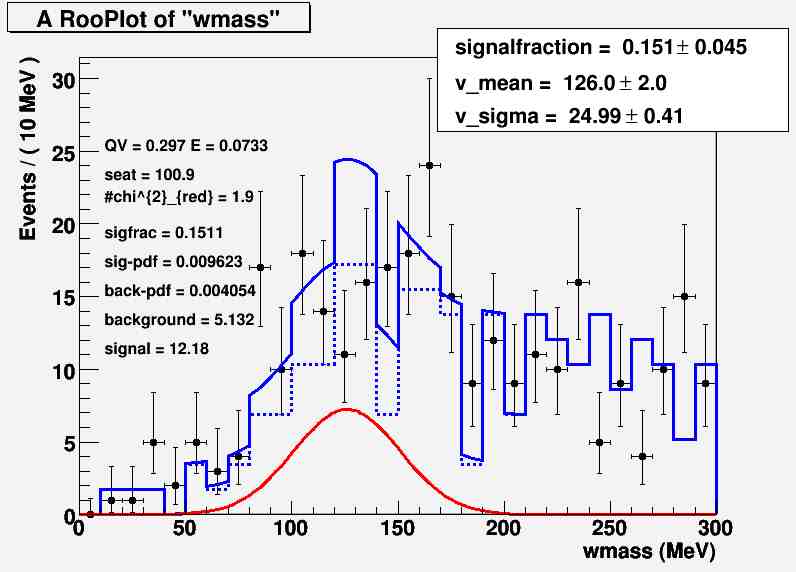
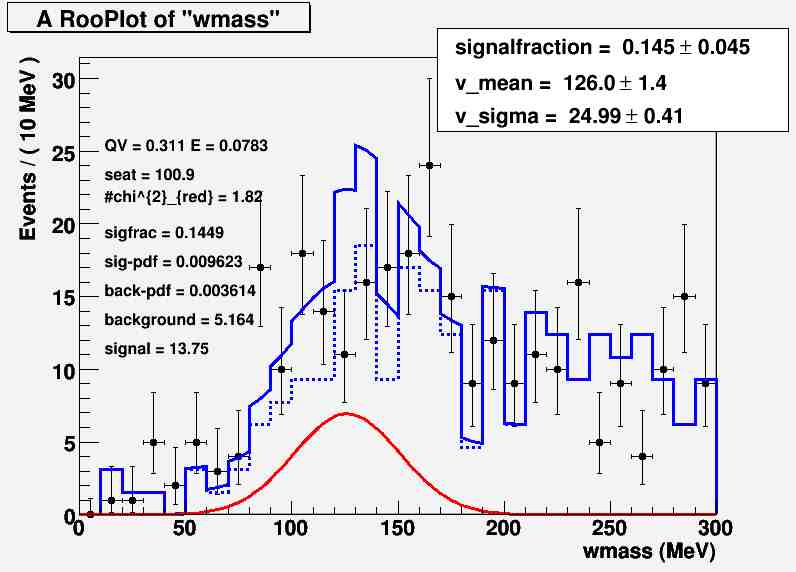
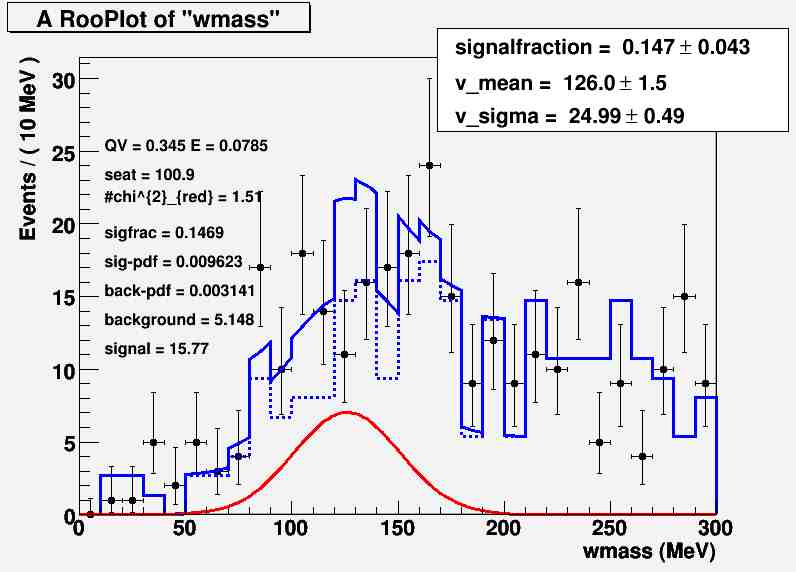
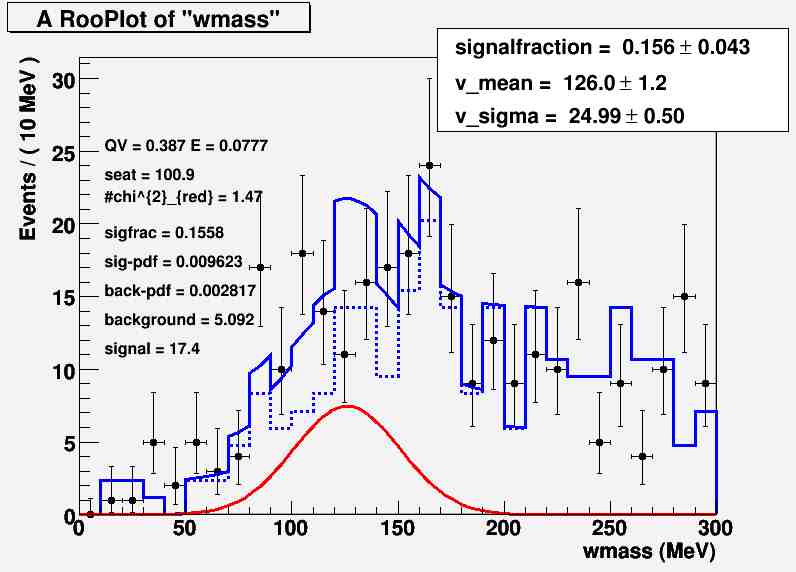
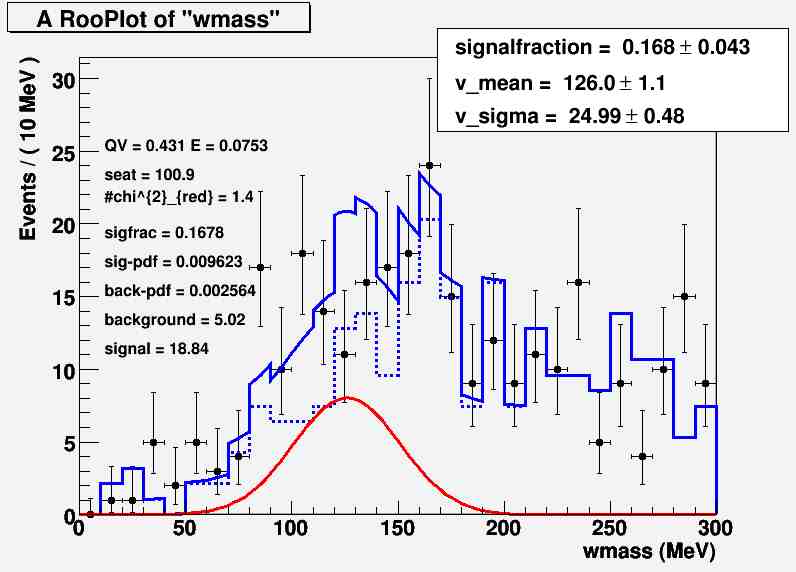
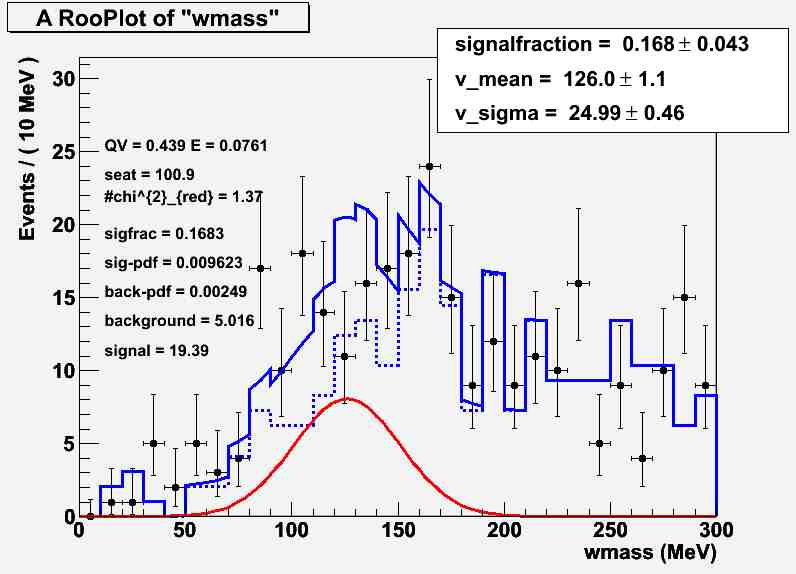
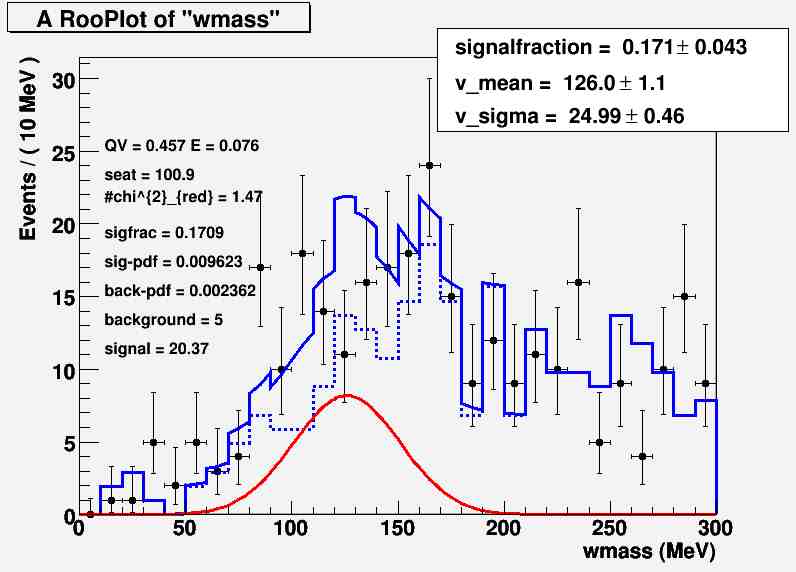
After working the Q-factor method |
 |
 |