| |
|
| |
|
 |
 |
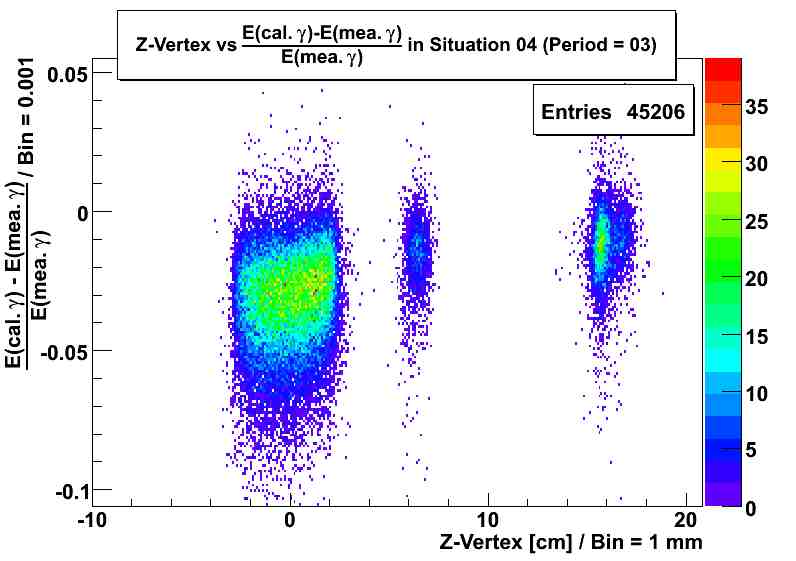
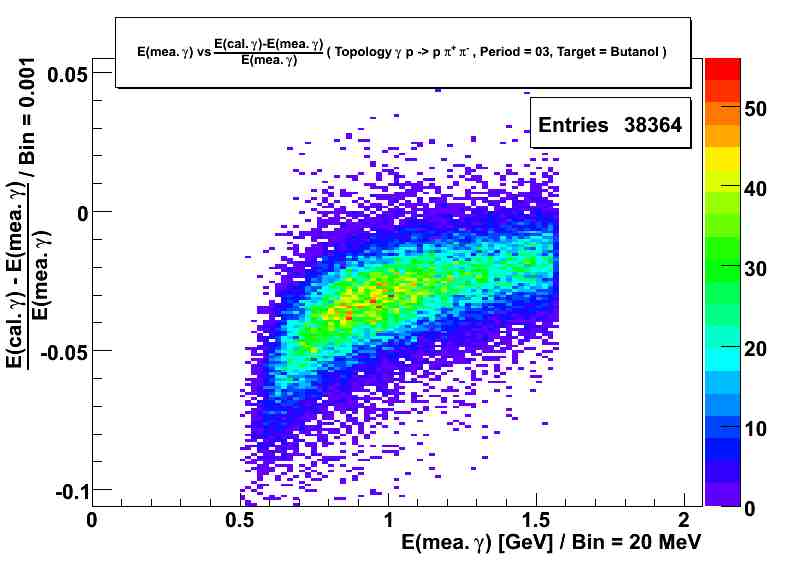
Before Eloss Correction |
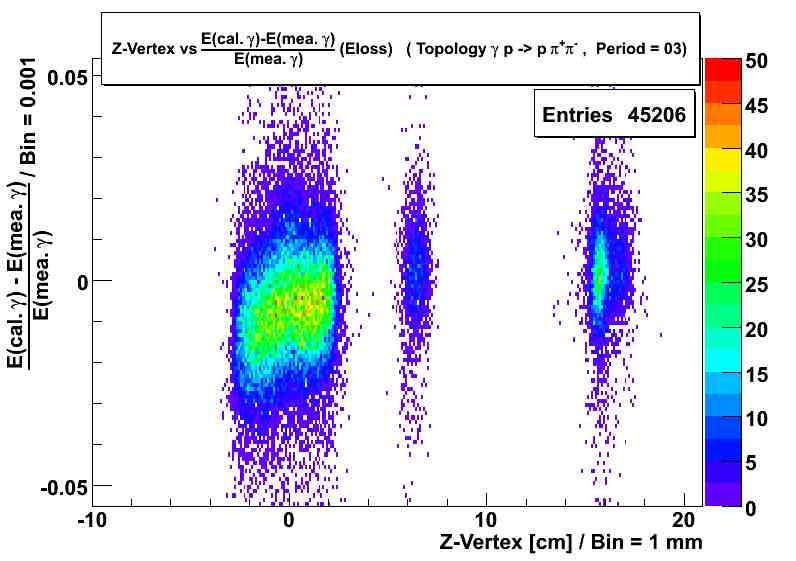
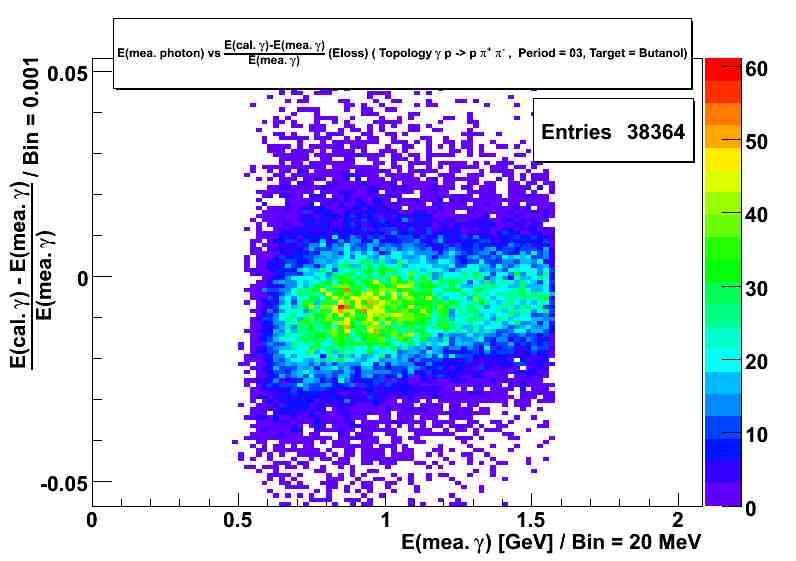
After Eloss Correction |
 |
 |
Before Eloss Correction |
After Eloss Correction |
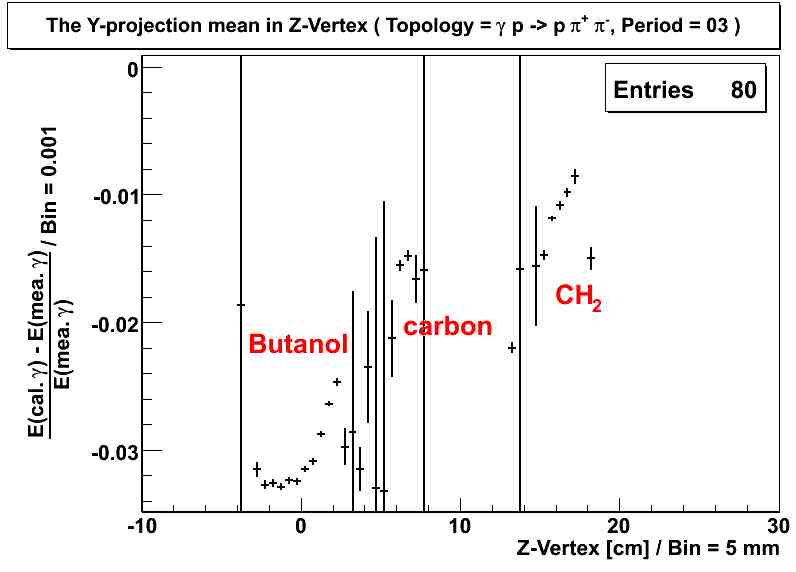
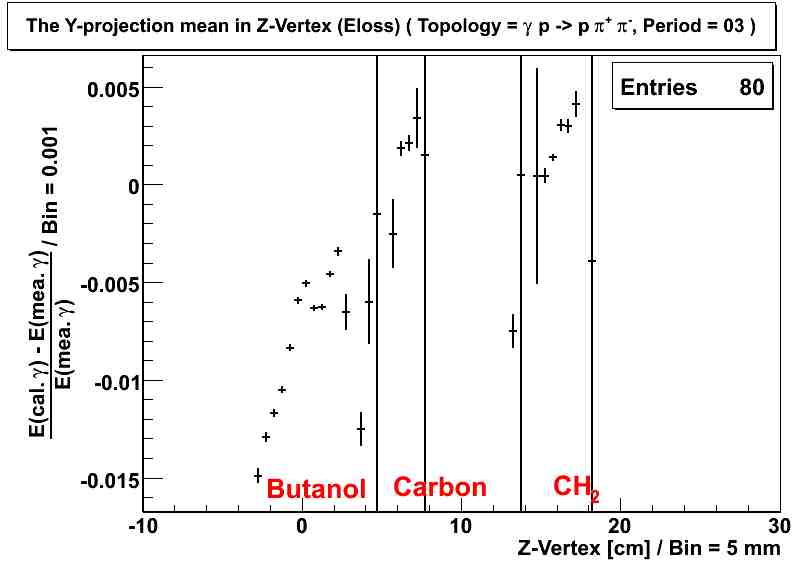
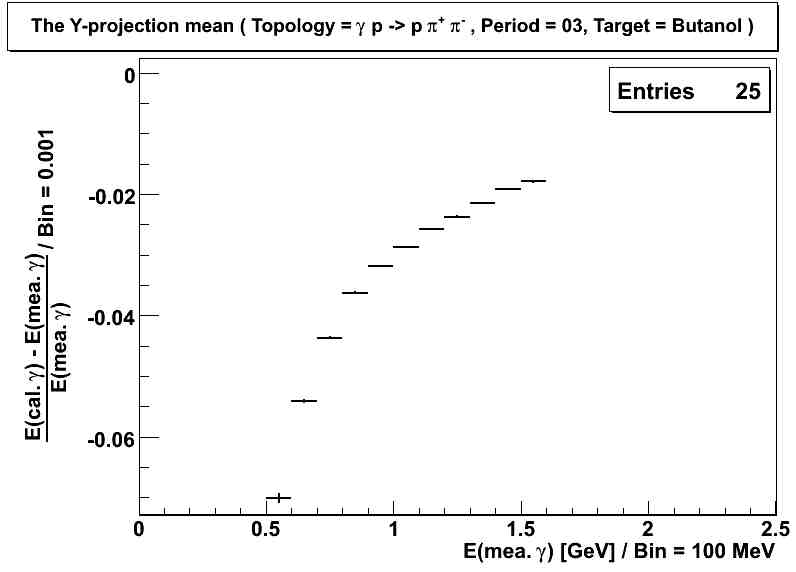
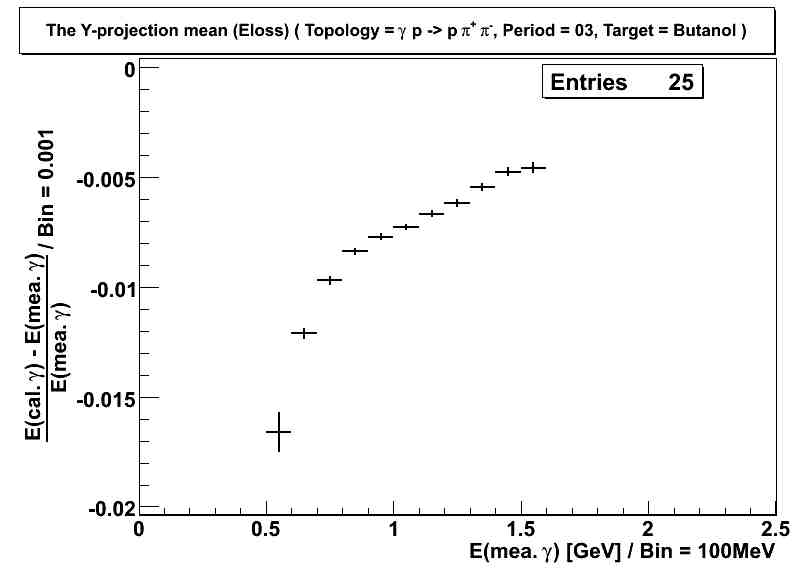
| Butanol | Butanol (Eloss) |
Before Eloss Correction |
After Eloss Correction |
 |
 |
py projection - Sigma |
py projection - Sigma (Eloss) |
Before Eloss Correction |
After Eloss Correction |
 |
 |
 |
 |
 |
 |
Before Eloss Correction |
After Eloss Correction |
| Butanol | Butanol (Eloss) |
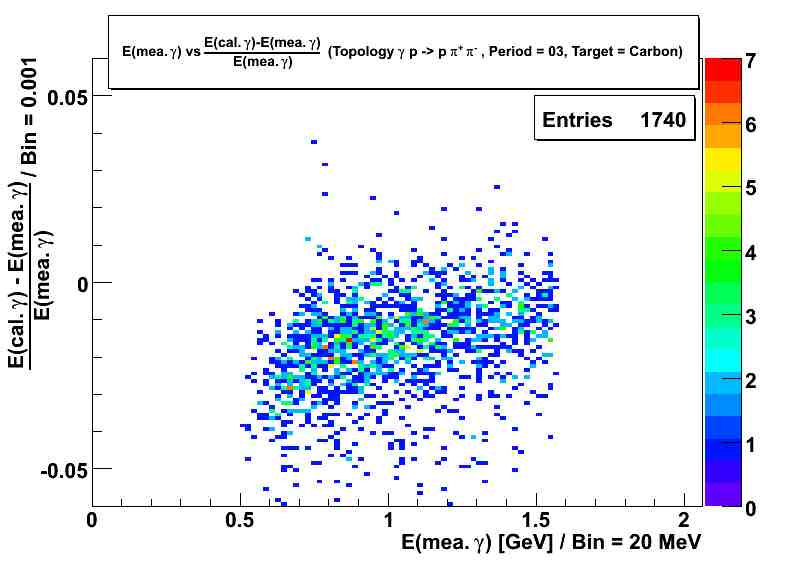
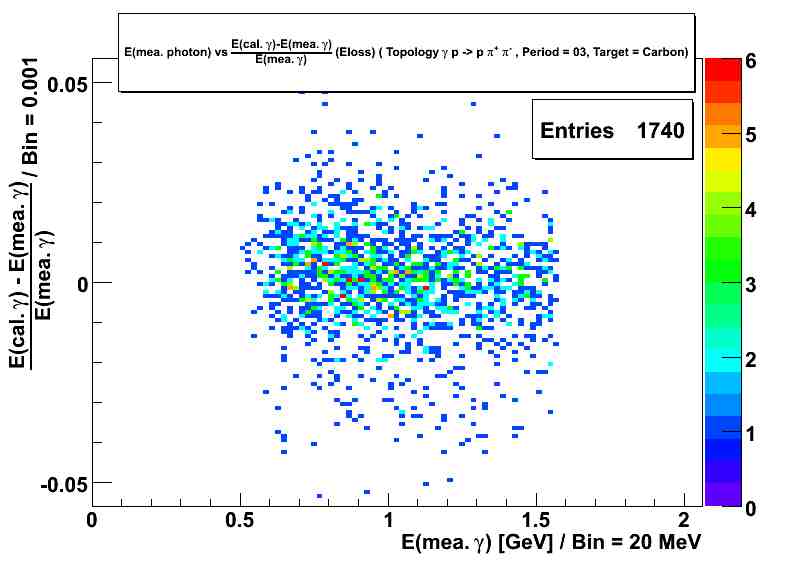
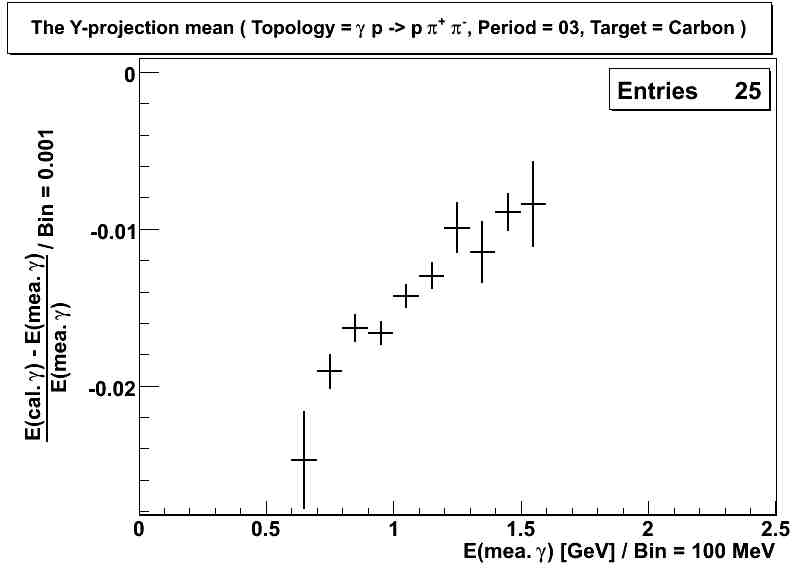
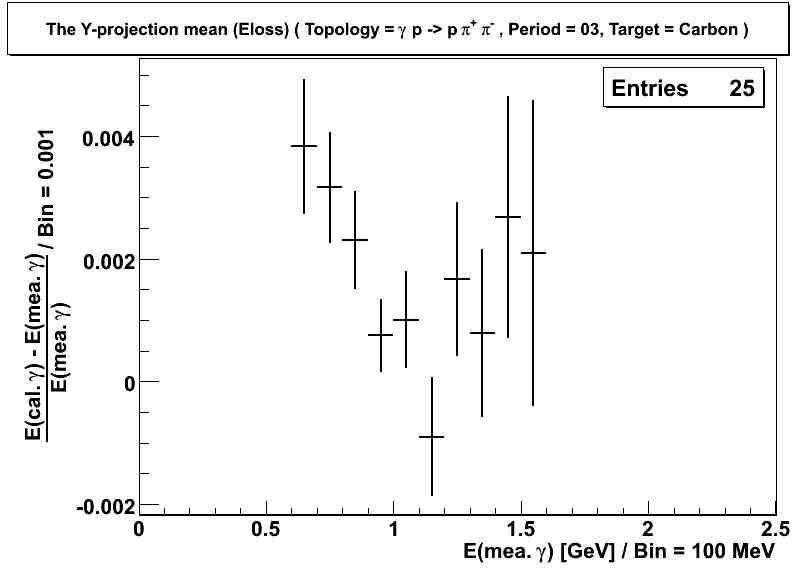
| Carbon | Carbon (Eloss) |
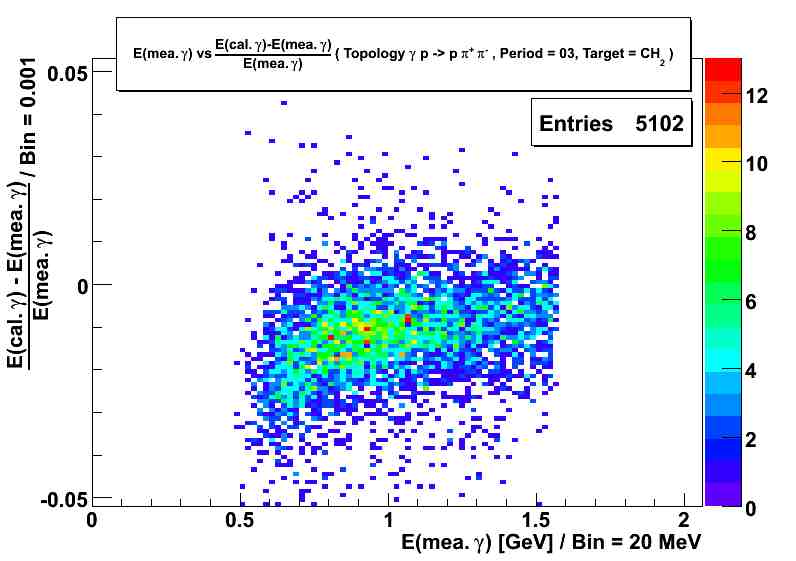
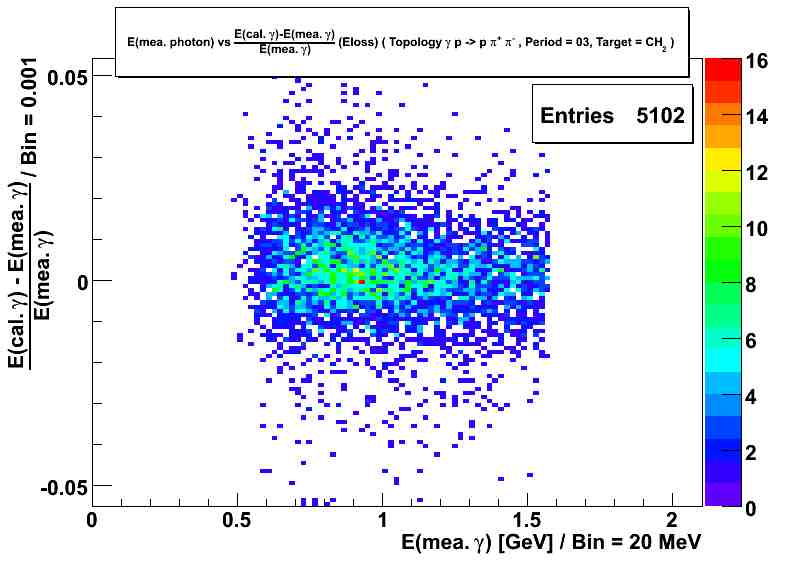
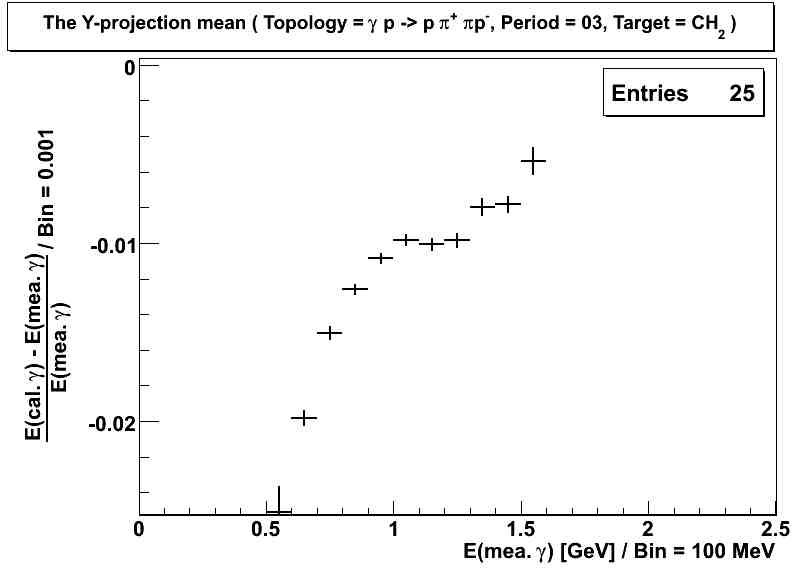
| CH2 | CH2 (Eloss) |
Before Eloss Correction |
After Eloss Correction |
 |
 |
py projection - Sigma (Butanol) |
py projection - Sigma (Eloss & Butanol) |
 |
 |
py projection - Sigma (Carbon) |
py projection - Sigma (Eloss & Carbon) |
 |
 |
py projection - Sigma (CH2) |
py projection - Sigma (Eloss & CH2) |