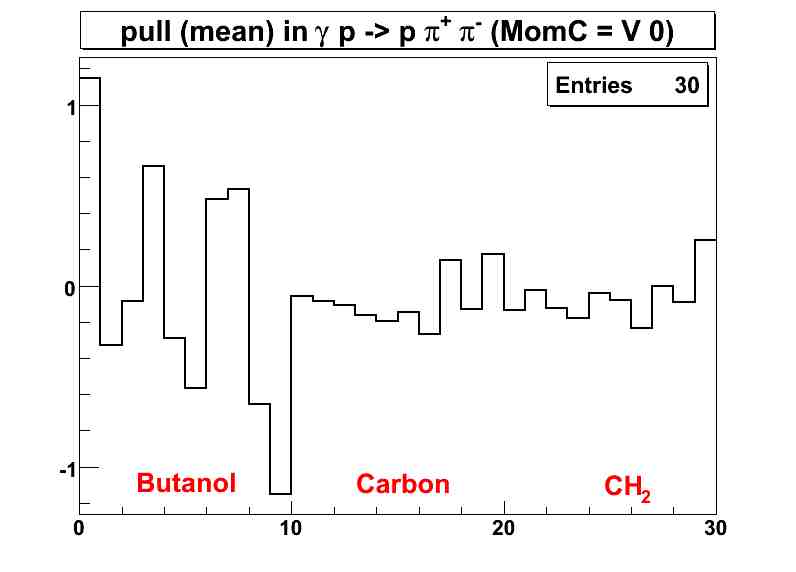
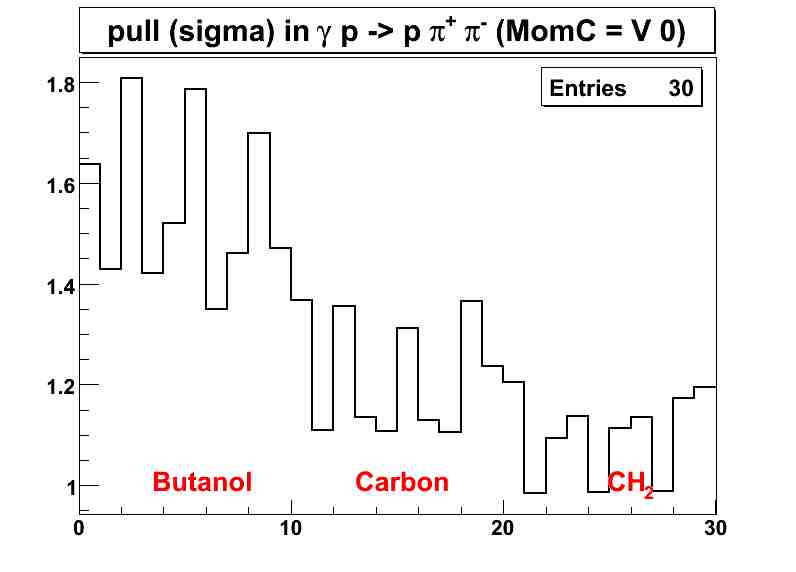
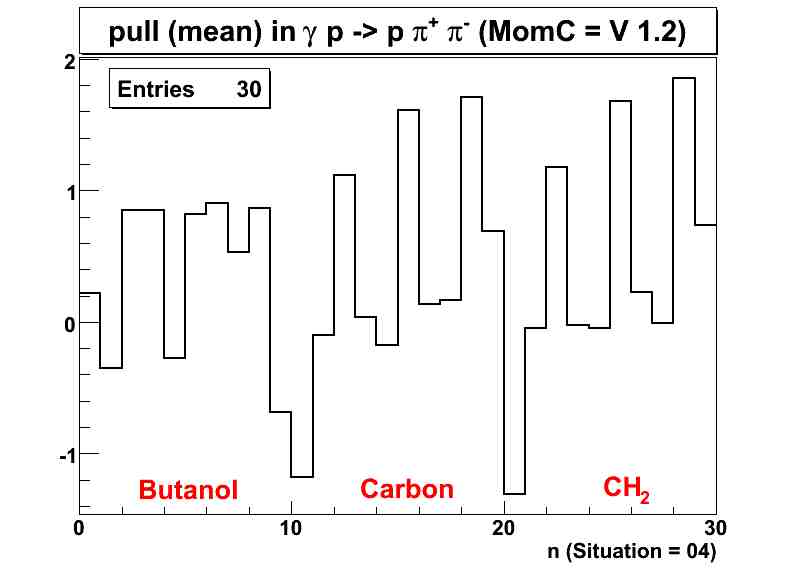
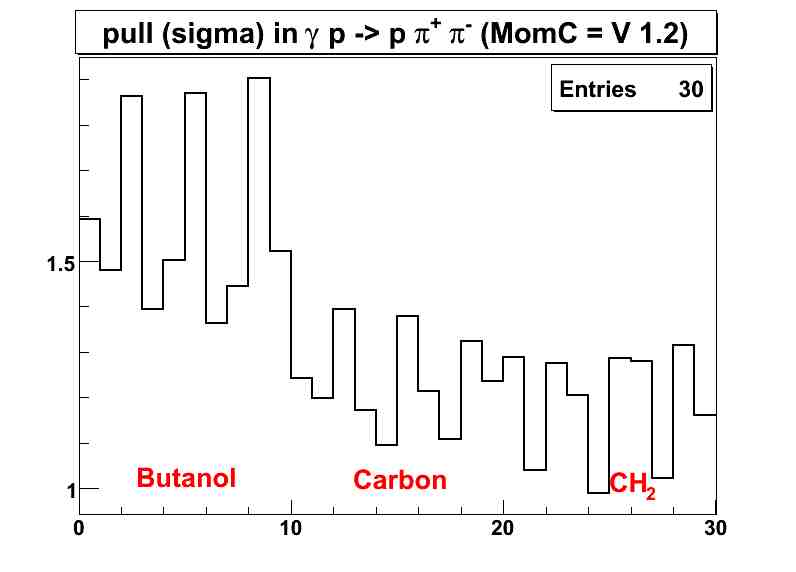
Bins of theta, phi, and momentum for the momentum correction

For proton

Momentum Binning

Momentum BinRange (GeV) Num. of events
1 0.2 - 0.5 1312
2 0.5 - 0.6 1362
3 0.6 - 0.7 1351
4 0.7 - 0.9 1544
5 0.9 - 1449

Theta and Phi Binning

Theta BinRange (GeV)
1 0 - 20
2 20 - 30
3 30 - 40
4 40 -
Phi BinRange (GeV)
1 0 - 30
2 30 - 60
3 60 - 90
4 90 - 120
5 120 - 150
6 150 - 180
7 180 - 210
8 210 - 240
9 240 - 270
10 270 - 300
11 300 - 330
12 330 - 360

For pion

Momentum Binning

Momentum BinRange (GeV) Num. of events
1 0.05 - 0.2 1389
2 0.2 - 0.27 1426
3 0.27 - 0.35 1315
4 0.35 - 0.53 1362
5 0.53 - 1572

Theta and Phi Binning

Theta BinRange (GeV)
1 0 - 20
2 20 - 30
3 30 - 40
4 40 - 50
5 50 - 60
6 60 - 70
7 70 - 80
8 80 - 90
9 90 - 100
10 100 -110
11 110 -
Phi BinRange (GeV)
1 0 - 30
2 30 - 60
3 60 - 90
4 90 - 120
5 120 - 150
6 150 - 180
7 180 - 210
8 210 - 240
9 240 - 270
10 270 - 300
11 300 - 330
12 330 - 360

E-beam 2.478 GeV E-beam 1.645 GeV
0.2 - 0.5 0.5 - 0.6 0.6 - 0.7 0.7 - 0.85 0.85 -
1312 1362 1351 1266 1727
0.2 - 0.5 0.5 - 0.6 0.6 - 0.7 0.7 - 0.9 0.90 -
1312 1362 1351 1544 1449
0.2 - 0.5 0.5 - 0.6 0.6 - 0.7 0.7 - 0.85 0.85 -
1305 1436 1333 1303 1248
0.2 - 0.5 0.5 - 0.6 0.6 - 0.7 0.7 - 0.9 0.9 -
1305 1436 1333 1583 988
0.05 - 0.195 0.195 - 0.25 0.25 - 0.32 0.32 - 0.46 0.46 -
1271 1277 1158 1385 2072
0.05 - 0.20 0.2 - 0.27 0.27 - 0.35 0.35 - 0.53 0.53 -
1389 1426 1315 1362 1572
0.05 - 0.195 0.195 - 0.25 0.25 - 0.32 0.32 - 0.46 0.46 -
1323 1395 1308 1390 1305
0.05 - 0.20 0.2 - 0.27 0.27 - 0.35 0.35 - 0.53 0.53 -
1446 1596 1322 1303 958

3 Run ( Period 3 ) : run 55570, 55580, 55593

The currect data distribution

The following is the data distribution of the three runs of g9a in φ, θ, and momentum variables. The left colume is for the proton, and the right is for for π- (Bascially, the data distribution of π+ and π- are the same.) In the 2D histogram of φ vs θ, the part of φ is divided to the six region as the six sextors of the CLAS dectector. The distribution of the θ of proton and φ- is different. (0 < θ < 60 for proton and 0 < &theta < 140 for pion). The distribution of the momentum for proton and pion is also different. We can use the same π bin for the proton and pion. However, the θ and momentum bins must be used differently in the proton and pion.

The g8b's bin distribution

The following is the bin definition g8b used. In g9a, the θ bin and π bin can be used continuely. However, in the case of momentum bin, we can not use them. In the momentum correction, the most important factor is the number of events in each bins. I check them in the g8b's momentum bin distribution. In case of the proton and pion, manu events are included in a few bins. In others bins, there may be some problems to use the gaussian fitting. I make new bin distribution of the momentum for g9a.

proton

π-


The g9a's bin distribution

I try to distribute the same number of events in each momentum bin.

proton

π-

The following files have new bins for g9a's momentum correction. In the file, there is θ, φ, momemtum, and correction factor.
Now the goal of the g9a's momentum correction is that the means of the all pulls should be near zero and the sigmas are near 1. If I give three variable (cor_facfor for proton, cor_facfor for π+, and cor_facfor for π-), the thirty variables are changed in the pill distribution (the means of mom, λ, and φ in the proton, π+, and π- and the mean of photon pull). In the following plot, the x-axis presents these thirty variables.
x - axis definition
1 mean or sigma of the momentum pull in the proton in the butanol
2 mean or sigma of the &lambda pull in the proton in the butanol
3 mean or sigma of the &phi pull in the proton in the butanol
4 mean or sigma of the momentum pull in the π+ in the butanol
5 mean or sigma of the &lambda pull in the π+ in the butanol
6 mean or sigma of the &phi pull in the π+ in the butanol
7 mean or sigma of the momentum pull in the π- in the butanol
8 mean or sigma of the &lambda pull in the π- in the butanol
9 mean or sigma of the &phi pull in the π- in the butanol
10 mean or sigma of the photon pull in the butanol
11 mean or sigma of the momentum pull in the proton in the carbon
12 mean or sigma of the &lambda pull in the proton in the carbon
13 mean or sigma of the &phi pull in the proton in the carbon
14 mean or sigma of the momentum pull in the π+ in the carbon
15 mean or sigma of the &lambda pull in the π+ in the carbon
16 mean or sigma of the &phi pull in the π+ in the carbon
17 mean or sigma of the momentum pull in the π- in the carbon
18 mean or sigma of the &lambda pull in the π- in the carbon
19 mean or sigma of the &phi pull in the π- in the carbon
20 mean or sigma of the photon pull in the carbon
21 mean or sigma of the momentum pull in the proton in the CH2
22 mean or sigma of the &lambda pull in the proton in the CH2
23 mean or sigma of the &phi pull in the proton in the CH2
24 mean or sigma of the momentum pull in the π+ in the CH2
25 mean or sigma of the &lambda pull in the π+ in the CH2
26 mean or sigma of the &phi pull in the π+ in the CH2
27 mean or sigma of the momentum pull in the π- in the CH2
28 mean or sigma of the &lambda pull in the π- in the CH2
29 mean or sigma of the &phi pull in the π- in the CH2
30 mean or sigma of the photon pull in the CH2
MomC Version 0 means correction factors of the proton, π+, and π- are 1. That is, Their pull distribution is the same with the pull after applying eloss correction.
MomC Version 1,2 means I use the following correction factor :

10 Run ( Period 3 )

Butanol (MomC V1.2)

Carbon (MomC V1.2)

CH2 (MomC V1.2)

Conclusion :

Aftet applying MomC Ver. 1.2, the mean value of the proton pull in butanol is improved, But others values are worst. As the pull distributions are very sensitive, we need to think about better correction factor.