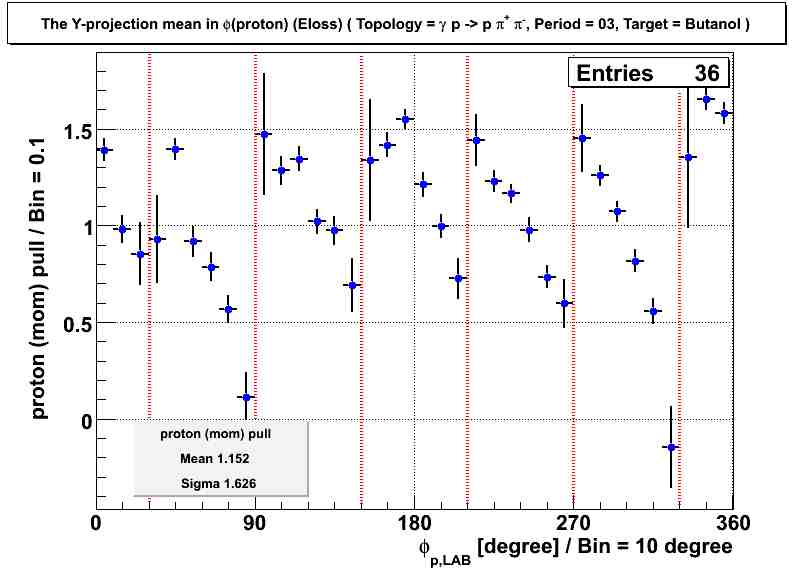
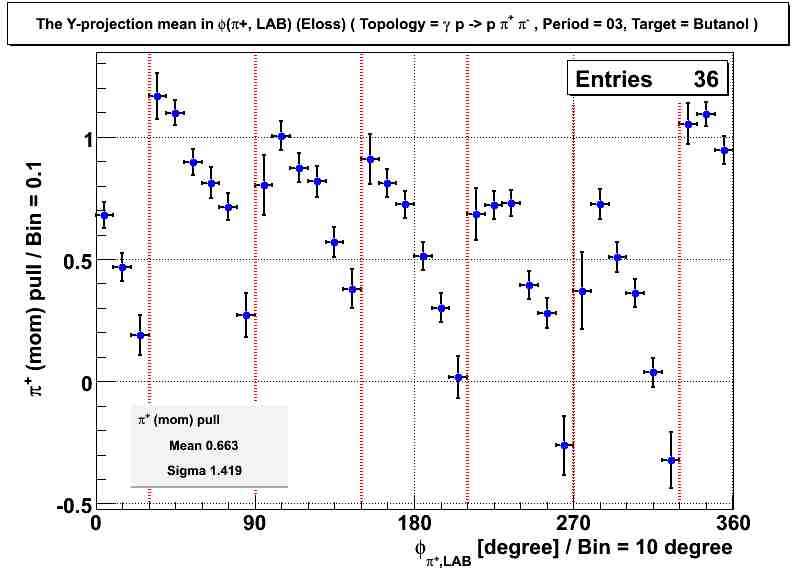
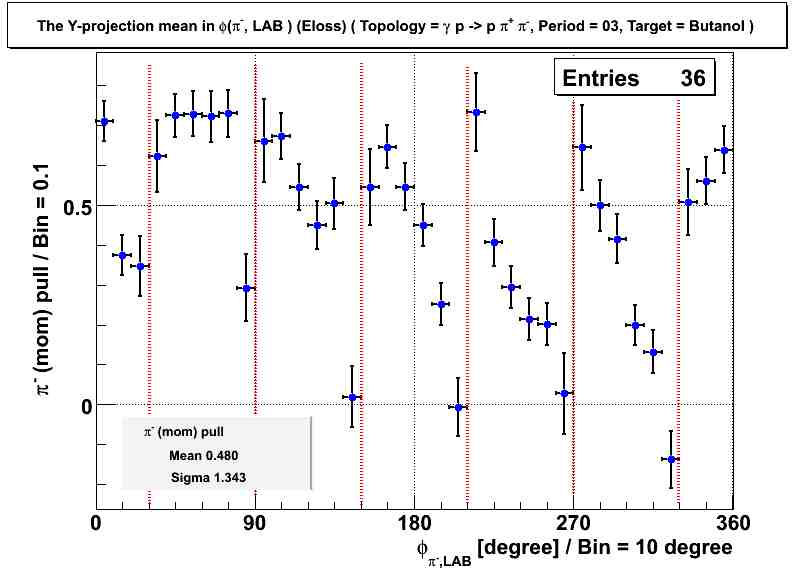
The φ dependence of the pull distribution
I make the following plots to see a φ-dependence in the double-pion data.
The x-axis is the φ angle of each particle in the LAB system and the y-axis is the momentum pull of each particle.
The CLAS spectrometer is divided to 6 sectors and these sectors are expressed as the red line in the following.
There are mean and sigma of each momemtum pull at the left and bottom part. We can compare the following with the http://www.jlab.org/Hall-B/secure/g9/g9_strauch/mtg/20100414.pdf
The proton
The π+
The π-
If you want to show clearer pictures, use the eps files