Research : The dilution factor and The scaling factor
The character of data I used
- The electron beam energy : 1.645 [GeV]
- The photon energy : 0.3 - 1.5 [GeV]
- The period 3 : the all runs
- The angle : The full angle
The topology
- γ P -> P π+ (π-)
- γ P -> P π- (π+)
- γ P -> π- π+ (P)
- γ P -> π- π+ P ()
The Xaxis is the Energy Bin. I used the data that the electron beam energy is 1.645 GeV. In this case, The initial photon energy is from 0.329 to 1.563 GeV. I divide this into 12 interval.
| Energy[GeV] | 0.3-0.4 | 0.4-0.5 | 0.5-0.6 | 0.6-0.7 | 0.7-0.8 | 0.8-0.9 | 0.9-1.0 | 1.0-1.1 | 1.1-1.2 | 1.2-1.3 | 1.3-1.4 | 1.4-1.5 |
| EBin | 1 | 2 | 3 | 4 | 5 | 6 | 7 | 8 | 9 | 10 | 11 | 12 |
The following is the scaling factor in each Energy Bin when the topology γ P -> π+ π- (P) and period 3. The mean scaling factor is 5.346.
The dilution factor is the ratio between N(Butanol)[Green plot] and N(Carbon X scaling_factor)[Red plot]. I calculated the number of events in the missing mass range [0.81,0.9604] in the butanol and carbon target. Steffen has the 0.51 as the dilution factor.
I found the definition of the dilution factor from Shifeng Chen's (5.3 Dilution Factor, page 84) dissertation paper. By his paper, The dilution factor is defined as the ratio between the hydrogen and the full NH3 contribution to the cross section. To estimate the dilution factor, it was necessary to evalute the pure nitrogen contribution to the studied reaction. During EG1b, the data on a carbon target were taken to simulate the N contribution. The carbon data were normalized to NH3 data by comparing the negative tails of the missing mass square plots (see Fig. 5.9). The normalization constat (I think this normalization constant is the scaling factor) c = 2.575+-0.020 was measured.
 |
 |
 |
The target spin asymmetry was extracted as a function of φ and therefore the dilution factor was evaluated for different φ bins. Fig. 5.10 shows the dilution factor for different φ, and there is no dependence on φ. Therefore, a single dilution factor f = 0.901 +- 0.035 based on the integrated-φ was calculated and used in the final analysis.
In FROST experiment, we use the butanol(C4H9OH) target. In this case, the definition of the dilution factor is that the ratio between the hydrogen and the full butanol contribution to the cross section.
The scaling factor
The topology γ P -> P π+ (π-) |
 |
 |
The topology γ P -> P π- (π+) |
 |
 |
The topology γ P -> π- π+ (P) |
 |
 |
The topology γ P -> P π- π+ () |
 |
 |
The topology γ P -> P (π0) |
 |
 |
The topology γ P -> π0 (N) |
 |
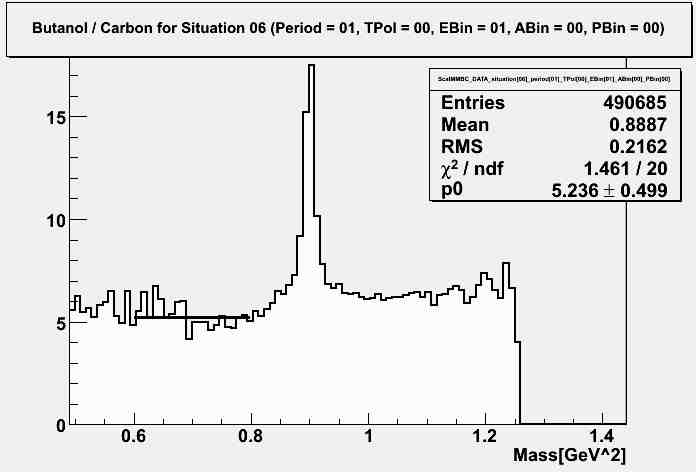 |
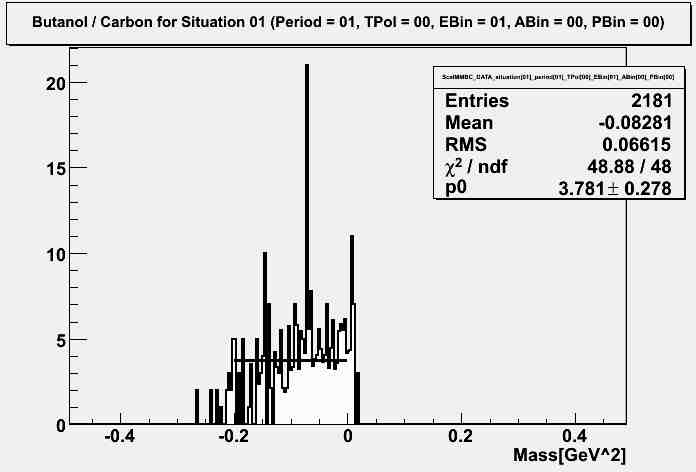
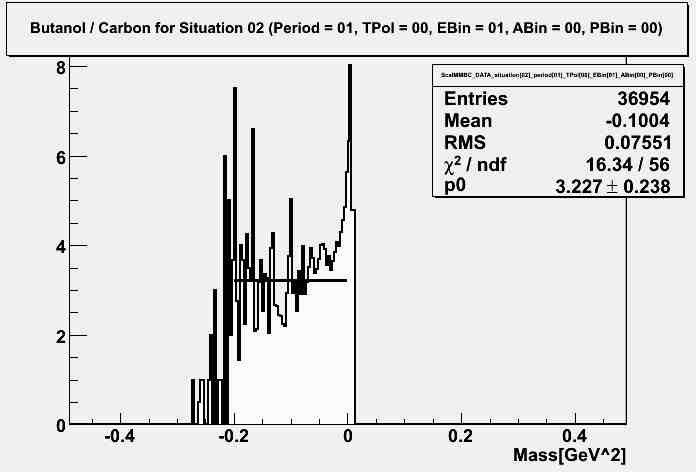
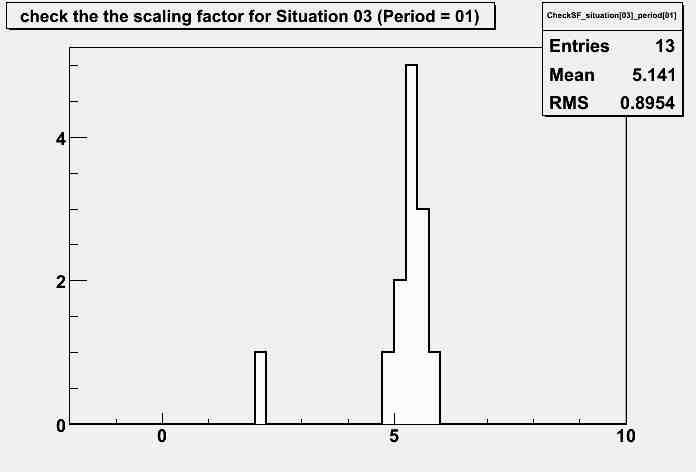
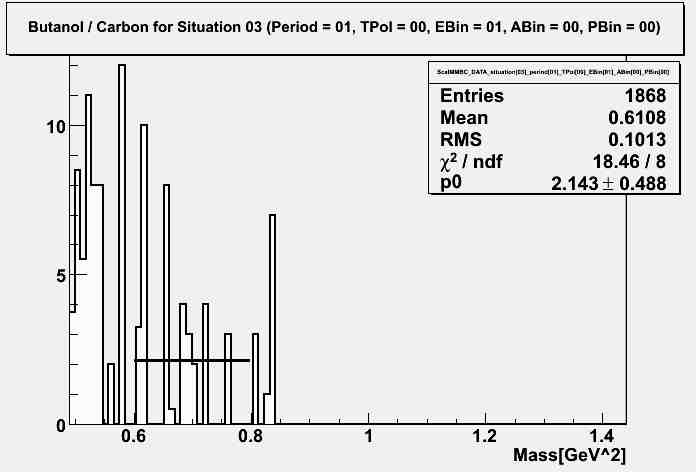
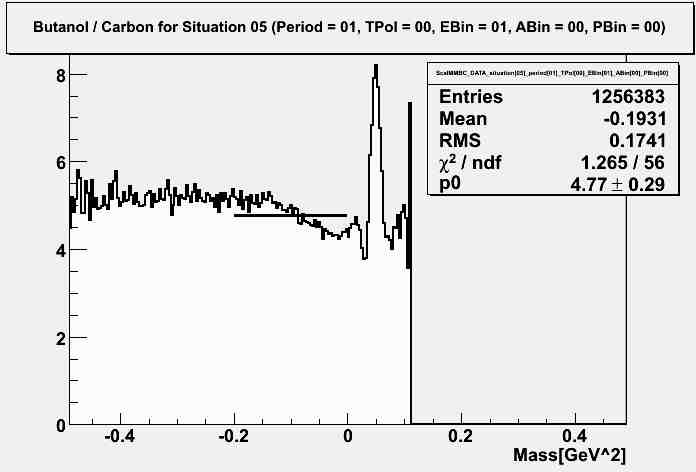
Finding the distribution of the scaling factors in the decay mode: γ P -> π+ π- (P)
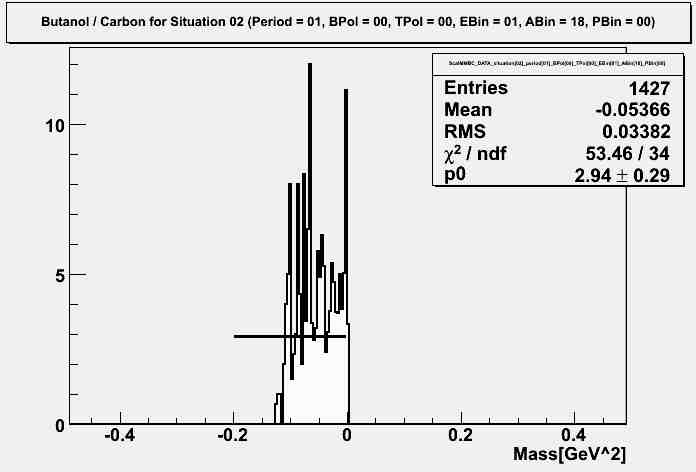
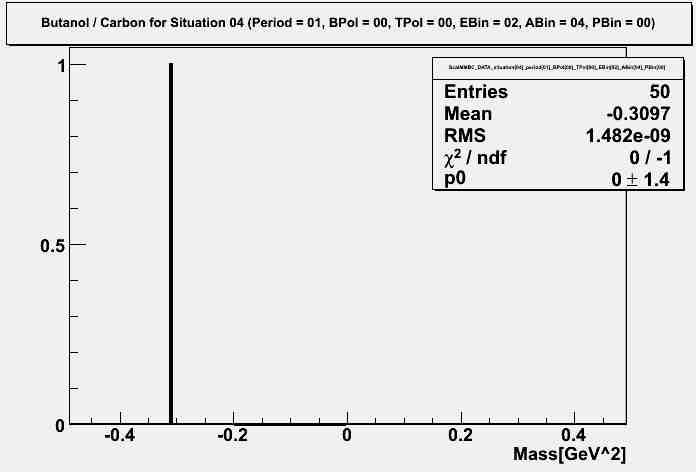
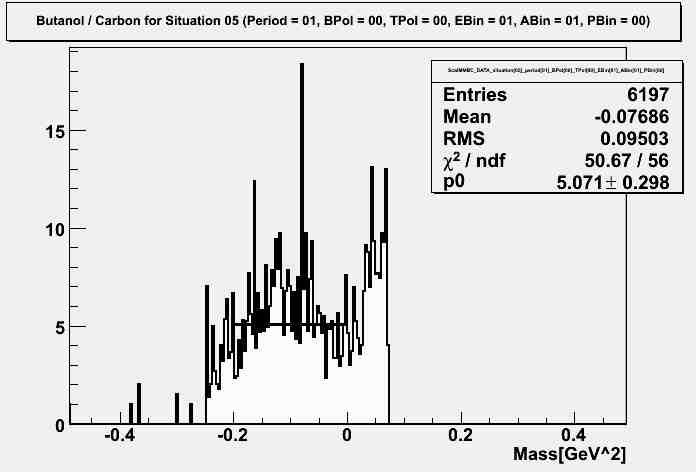
The scaling factor is found by diving the missing mass plot for the butanol target by the missing mass plot for the carbon target, and fitting it using the p0 function. In my code, I can make serval missing masse plots in serval variables. I uses the 6 situation, the 7 period, the 3 target type, the 2 beam polarization, the 2 target polarization, the 13 or 19 energy Bin, the 20 theta Bin, and the 10 phi Bin. I can make the 957,600 missing mass plots as the maximum number. We can find the scaling factors from these missing mass. In this research, I uses partial missing masse plots to find the scaling factors.
- situation: 3 (The topology γ P -> π+ π- (P)) [situation]
- period 1 [period]
- Beam polariozation : -> and <- [BPol]
- Target polarization : <= [TPol]
- Energy Bin : 0 - 12 [EBin]
- Theta Bin : 0 - 20 [ABin]
- Phi Bin : 0 [PBin]
In this condition, the missing mass with Energy Bin 0 has all bins from Energy Bin 1 to Energy Bin 12. Theta Bin 0 and Phi Bin 0 have the same meaning.
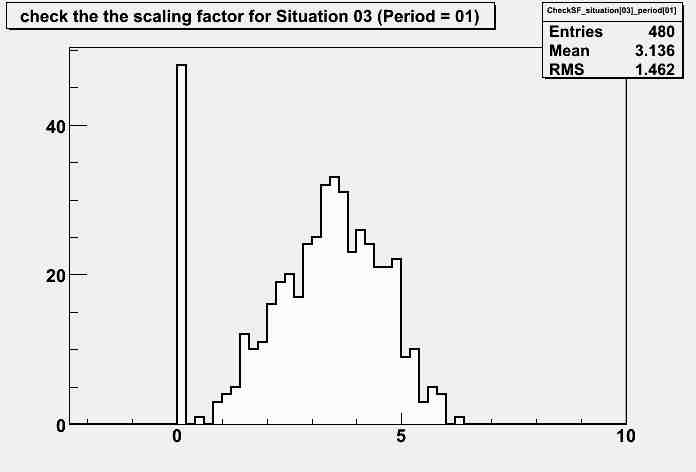
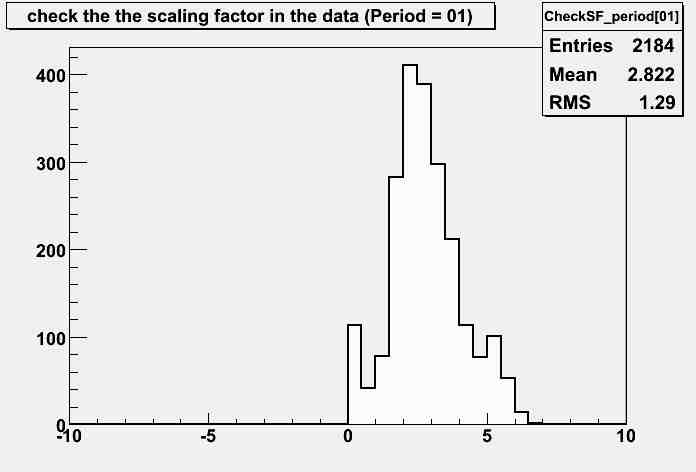
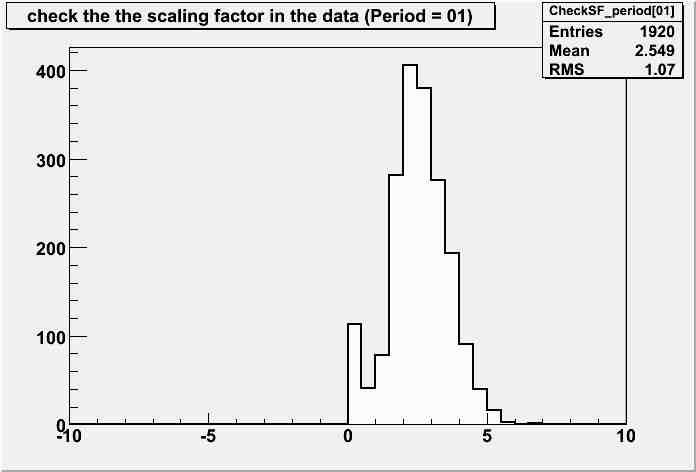
| without EBin 0 and ABin 0 |
with EBin 0 and ABin 0 |
 |
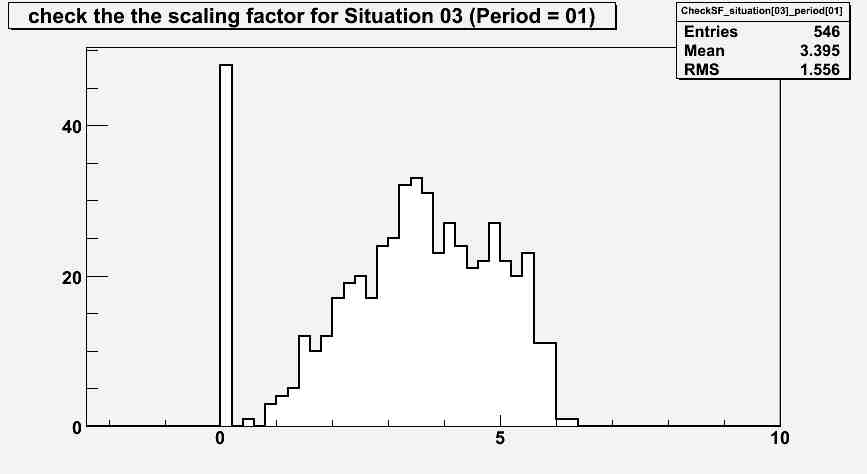 |
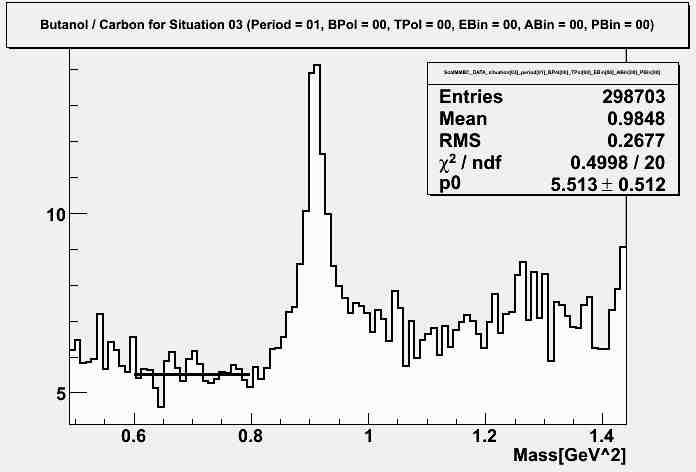
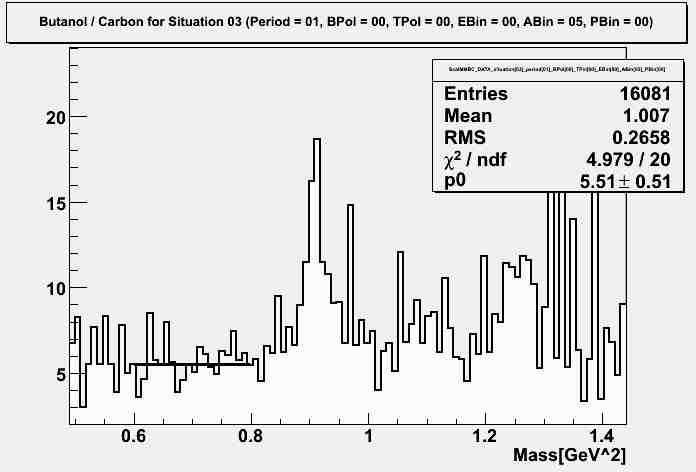
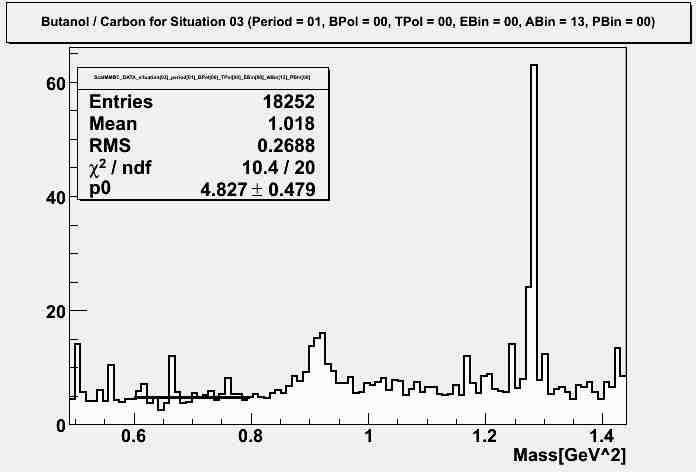
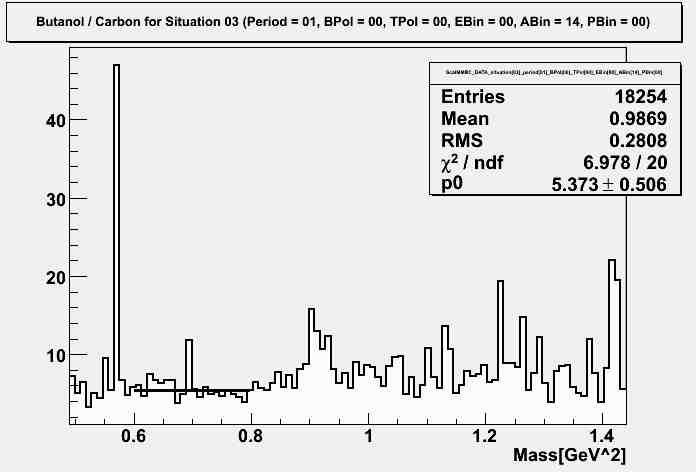
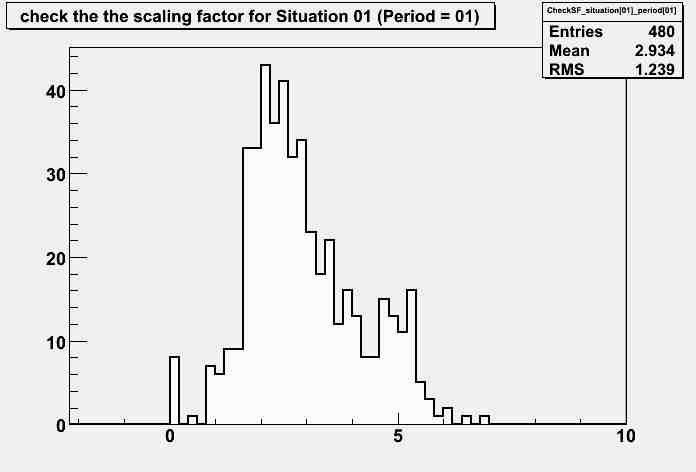
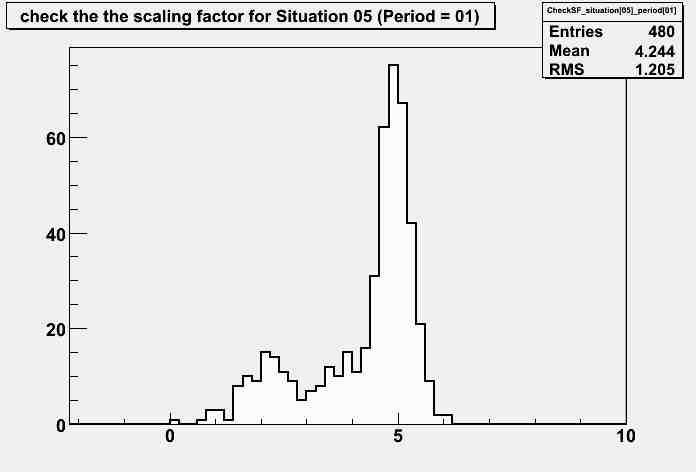
We need to discuss what these upper plots mean. In conclusion, these both plots are wrong. The means of the both plots are located in about 3.3, however, the scaling factor should be between 5 and 6. In the case of EBin = 00, the scaling factors are distributed between 5 and 6.
| Situation[03]period[01]BPol[00]TPol[00]EBin[00]ABin[00]PBin[00] |
Situation[03]period[01]BPol[00]TPol[00]EBin[00]ABin[05]PBin[00] |
 |
 |
| Situation[03]period[01]BPol[00]TPol[00]EBin[00]ABin[13]PBin[00] |
Situation[03]period[01]BPol[00]TPol[00]EBin[00]ABin[14]PBin[00] |
 |
 |
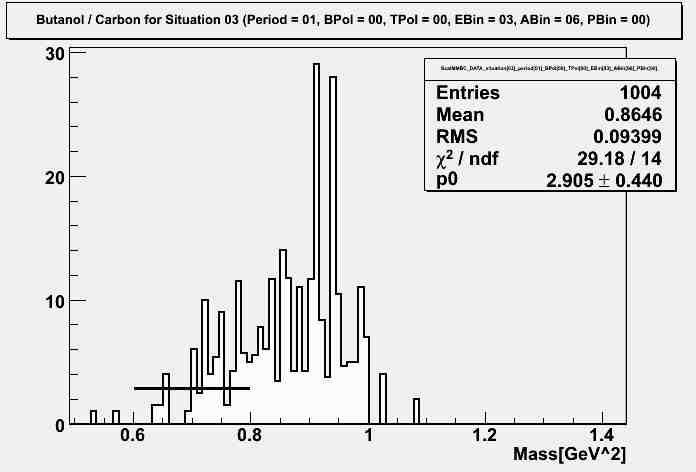
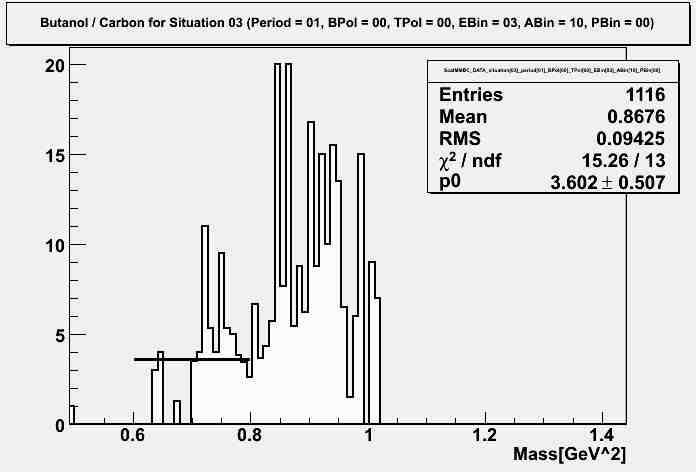
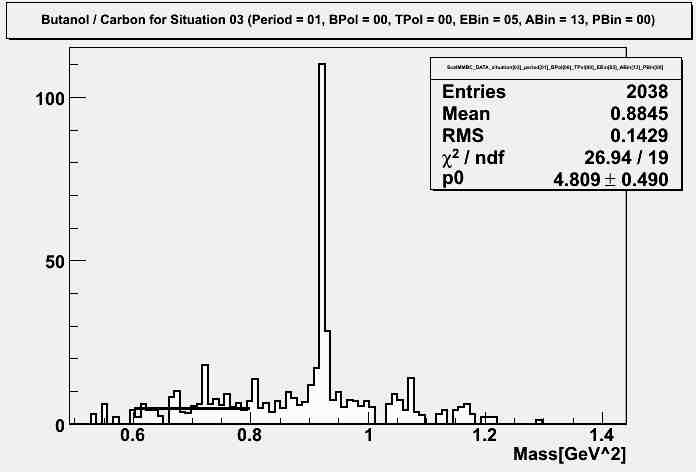
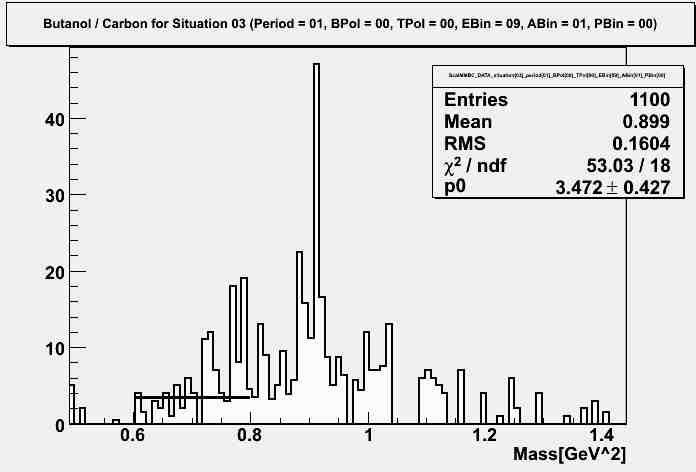
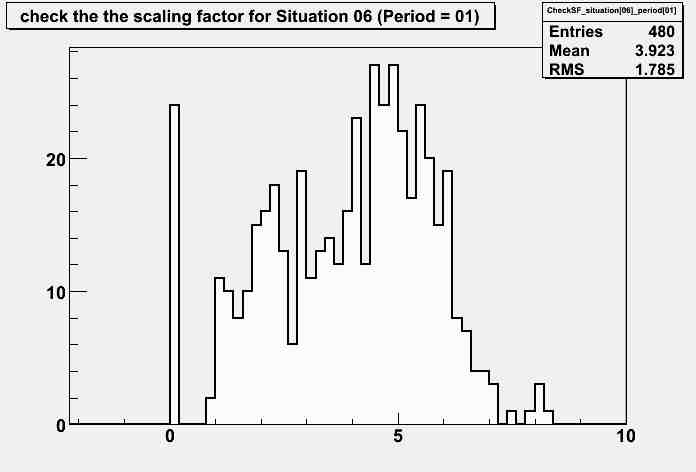
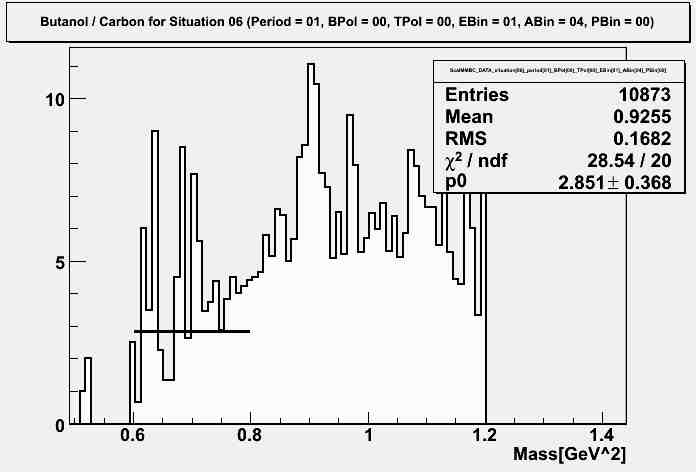
When the value of EBin is not 00, the scaling factors are distributed in the values of less than 5. When we check plots which have 3.602 and 3.472 as the scaling factor, the part for fitting is not flat. We can know that is wrong.
| Situation[03]period[01]BPol[00]TPol[00]EBin[03]ABin[06]PBin[00] |
Situation[03]period[01]BPol[00]TPol[00]EBin[03]ABin[10]PBin[00] |
 |
 |
| Situation[03]period[01]BPol[00]TPol[00]EBin[05]ABin[13]PBin[00] |
Situation[03]period[01]BPol[00]TPol[00]EBin[09]ABin[01]PBin[00] |
 |
 |
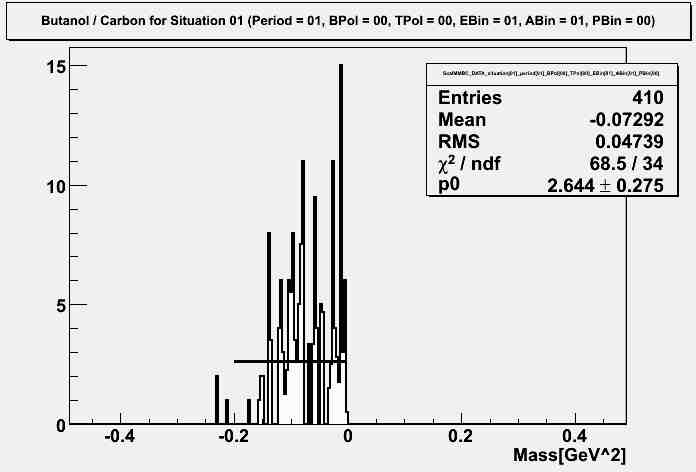
Question: How do we put the range for fitting in the mode γ P -> P π+ (π-)
I use from -0.4 to 0 as the range for fitting. Is it correct?
Finding the distribution of the scaling factors
The topology γ P -> P π+ (π-) |
 |
 |
The topology γ P -> P π- (π+) |
 |
 |
The topology γ P -> π+ π- (P) |
|
|
The topology γ P -> P π+ π- () |
 |
 |
The topology γ P -> P (π0) |
 |
 |
The topology γ P -> π0+ (N) |
 |
 |
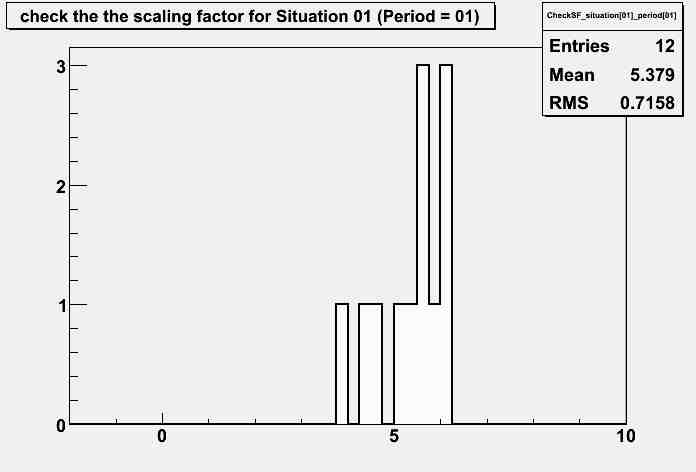
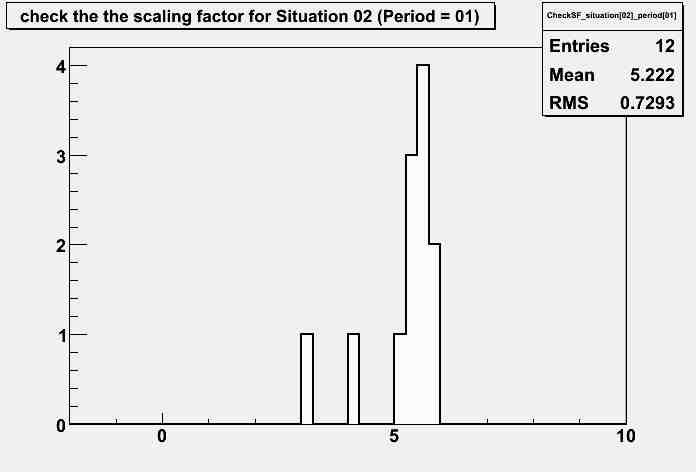
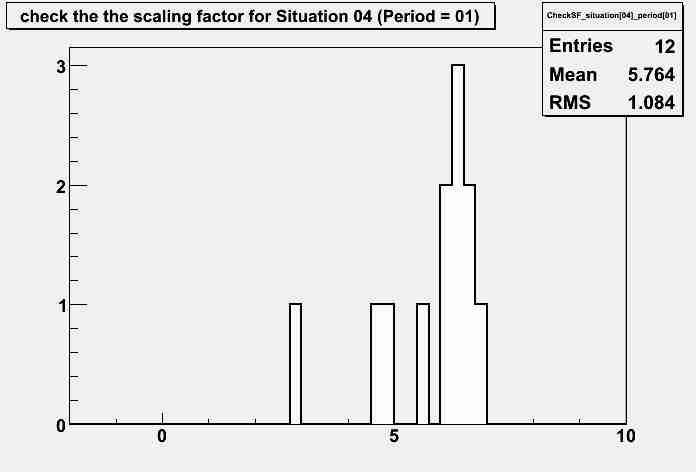
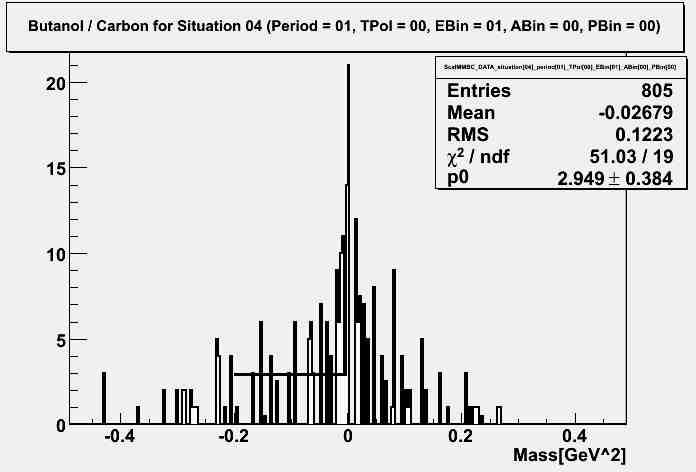
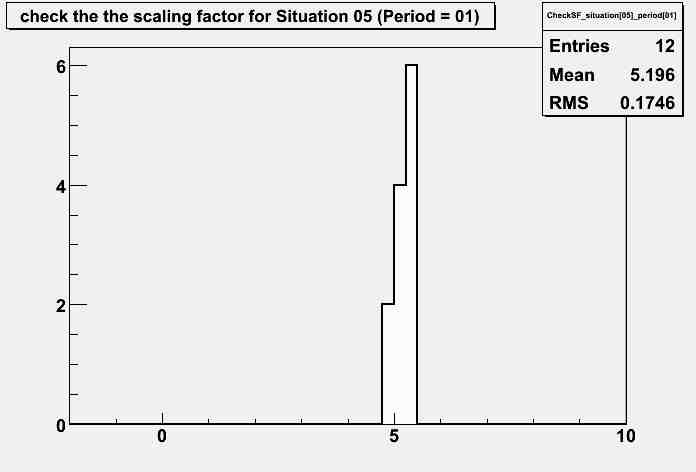
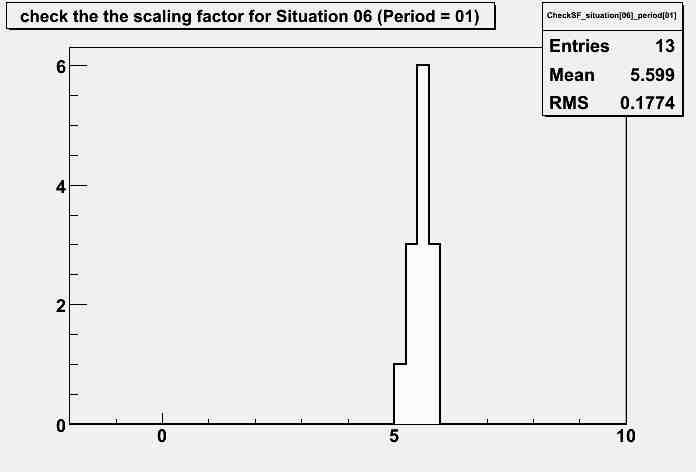
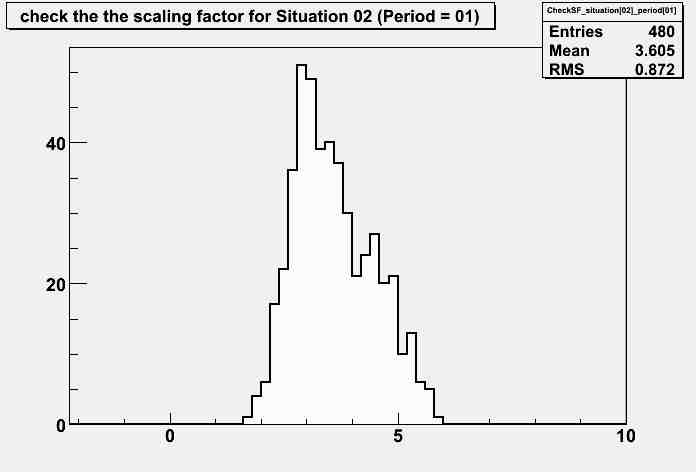
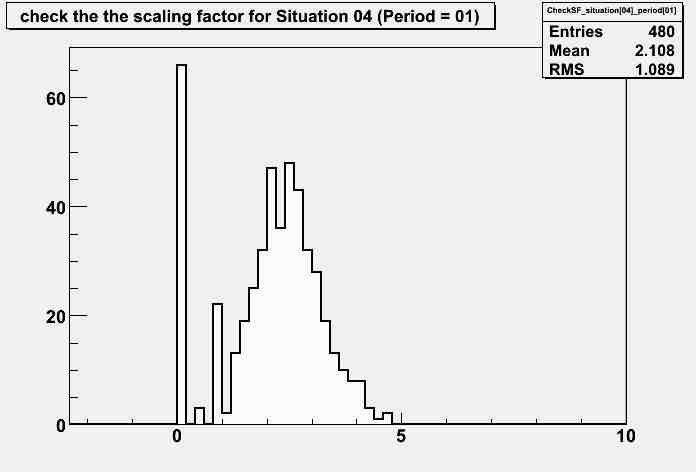
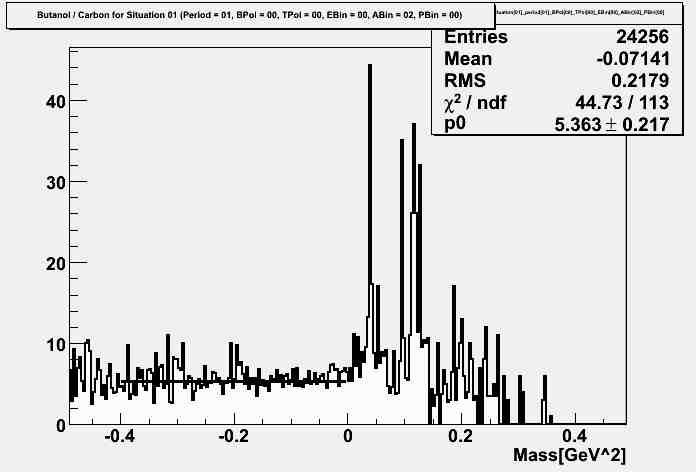
Finding the scaling factor in each detailed condition
I make the plot of the scaling factor from the following condition:
- situation: 1, 2, 3, and 4
- period 1
- Beam polariozation : -> and <-
- Target polarization : <=
- Energy Bin : 0 - 12
- Theta Bin : 0 - 20
- Phi Bin : 0
period 1 is the data for electron beam energy 1.645 GeV and I used 0.1 GeV as the energy Bin. So I only used 13 bins as the energy bin. 0 in Energy Bin, Theta Bin, and Phi Bin means the all data in each condition(I use your notation)
| with Ebin 0 and ABin 0 |
without Ebin 0 and ABin 0 |
 |
 |
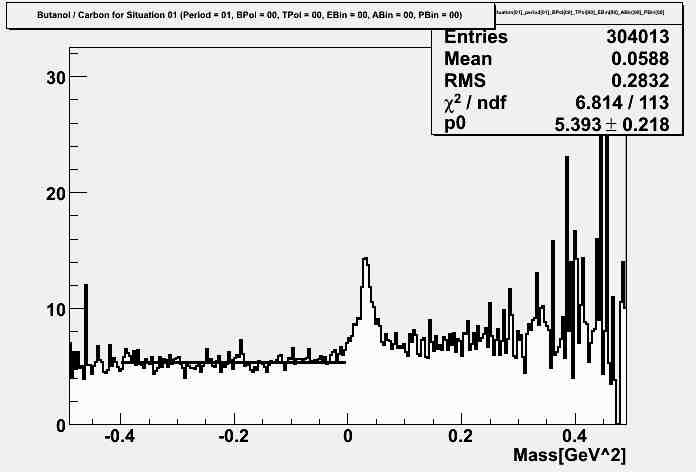
Sitution[01] Period[01] BPol[00] TPol[00] EBin[00] ABin[00] PBin[00] |
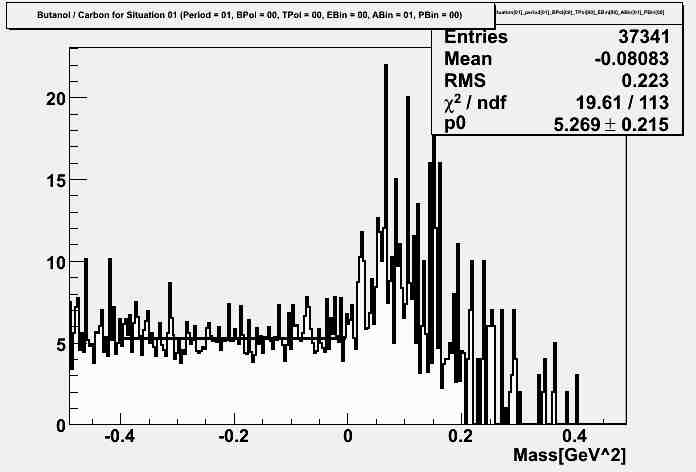
Sitution[01] Period[01] BPol[00] TPol[00] EBin[00] ABin[01] PBin[00] |
5.393 |
5.269 |
 |
 |
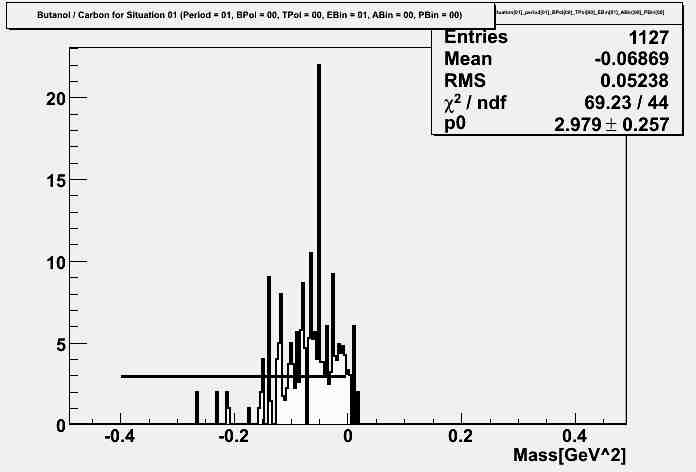
Sitution[01] Period[01] BPol[00] TPol[00] EBin[00] ABin[02] PBin[00] |
Sitution[01] Period[01] BPol[00] TPol[00] EBin[01] ABin[00] PBin[00] |
5.363 |
2.979 |
 |
 |
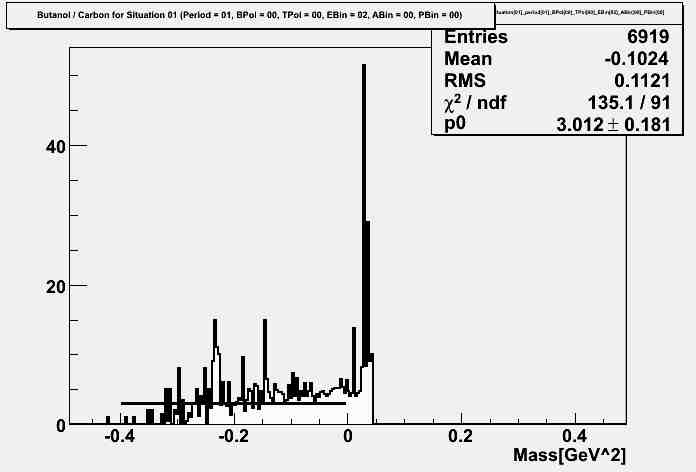
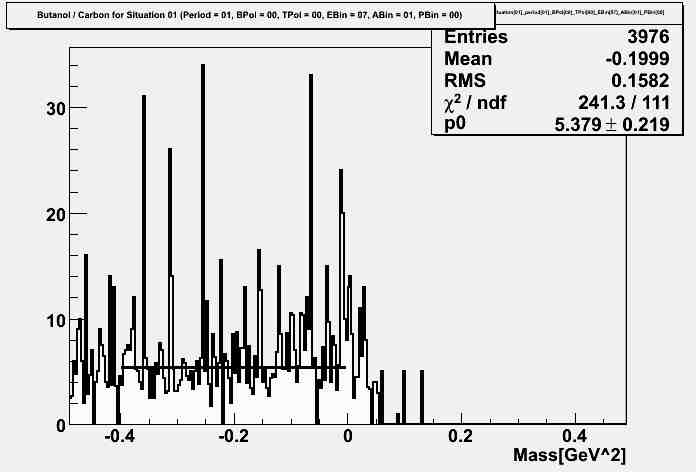
Sitution[01] Period[01] BPol[00] TPol[00] EBin[02] ABin[00] PBin[00] |
Sitution[01] Period[01] BPol[00] TPol[00] EBin[07] ABin[01] PBin[00] |
3.012 |
5.379 |
 |
 |
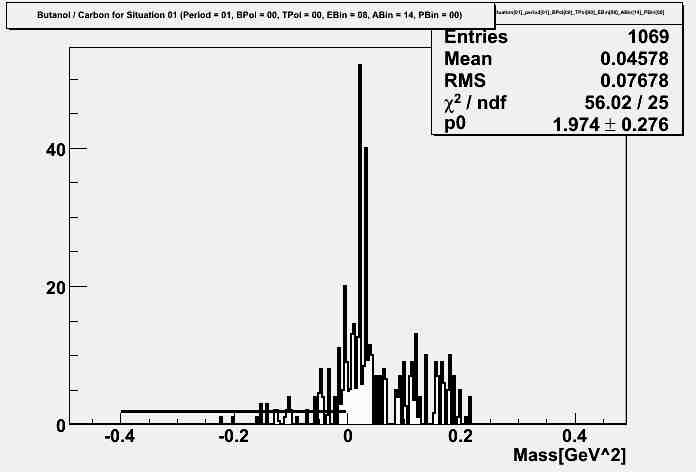
Sitution[01] Period[01] BPol[00] TPol[00] EBin[08] ABin[14] PBin[00] |
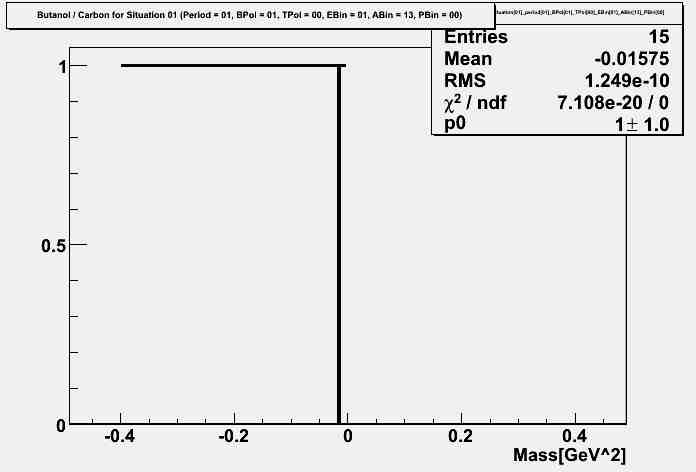
Sitution[01] Period[01] BPol[01] TPol[00] EBin[01] ABin[13] PBin[00] |
1.974 |
1.0 |
 |
 |


